Dutch West Indian vs African 8th Grade
COMPARE
Dutch West Indian
African
8th Grade
8th Grade Comparison
Dutch West Indians
Africans
95.4%
8TH GRADE
8.1/ 100
METRIC RATING
218th/ 347
METRIC RANK
95.4%
8TH GRADE
13.6/ 100
METRIC RATING
210th/ 347
METRIC RANK
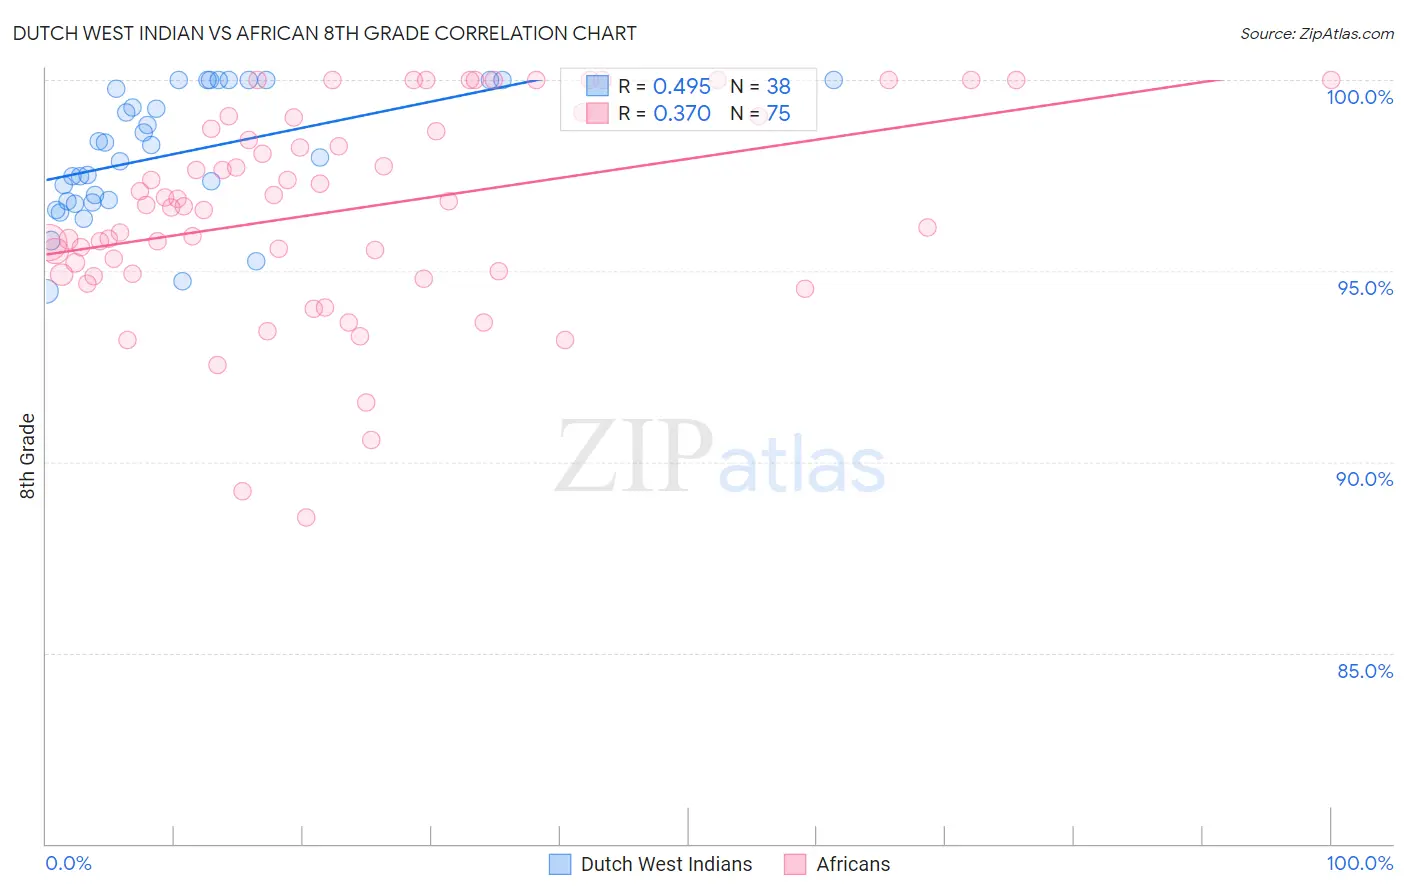
Dutch West Indian vs African 8th Grade Correlation Chart
The statistical analysis conducted on geographies consisting of 85,775,604 people shows a moderate positive correlation between the proportion of Dutch West Indians and percentage of population with at least 8th grade education in the United States with a correlation coefficient (R) of 0.495 and weighted average of 95.4%. Similarly, the statistical analysis conducted on geographies consisting of 470,094,744 people shows a mild positive correlation between the proportion of Africans and percentage of population with at least 8th grade education in the United States with a correlation coefficient (R) of 0.370 and weighted average of 95.4%, a difference of 0.090%.
8th Grade Correlation Summary
| Measurement | Dutch West Indian | African |
| Minimum | 94.5% | 88.6% |
| Maximum | 100.0% | 100.0% |
| Range | 5.5% | 11.4% |
| Mean | 98.1% | 96.6% |
| Median | 98.1% | 96.7% |
| Interquartile 25% (IQ1) | 96.8% | 94.9% |
| Interquartile 75% (IQ3) | 100.0% | 99.0% |
| Interquartile Range (IQR) | 3.2% | 4.1% |
| Standard Deviation (Sample) | 1.6% | 2.7% |
| Standard Deviation (Population) | 1.6% | 2.7% |
Demographics Similar to Dutch West Indians and Africans by 8th Grade
In terms of 8th grade, the demographic groups most similar to Dutch West Indians are Immigrants from Eastern Asia (95.4%, a difference of 0.0%), Spanish American (95.4%, a difference of 0.0%), Samoan (95.4%, a difference of 0.010%), Immigrants from Southern Europe (95.3%, a difference of 0.010%), and Immigrants from Syria (95.3%, a difference of 0.010%). Similarly, the demographic groups most similar to Africans are Immigrants from Lebanon (95.4%, a difference of 0.0%), Portuguese (95.5%, a difference of 0.010%), Immigrants from Sudan (95.5%, a difference of 0.020%), Immigrants from Morocco (95.4%, a difference of 0.020%), and Hawaiian (95.5%, a difference of 0.040%).
| Demographics | Rating | Rank | 8th Grade |
| Hawaiians | 16.7 /100 | #204 | Poor 95.5% |
| Immigrants | Bahamas | 16.7 /100 | #205 | Poor 95.5% |
| Comanche | 16.3 /100 | #206 | Poor 95.5% |
| Immigrants | Sudan | 15.1 /100 | #207 | Poor 95.5% |
| Portuguese | 14.3 /100 | #208 | Poor 95.5% |
| Immigrants | Lebanon | 13.7 /100 | #209 | Poor 95.4% |
| Africans | 13.6 /100 | #210 | Poor 95.4% |
| Immigrants | Morocco | 12.4 /100 | #211 | Poor 95.4% |
| Immigrants | Pakistan | 9.7 /100 | #212 | Tragic 95.4% |
| Laotians | 9.0 /100 | #213 | Tragic 95.4% |
| Immigrants | Chile | 9.0 /100 | #214 | Tragic 95.4% |
| Immigrants | Liberia | 8.9 /100 | #215 | Tragic 95.4% |
| Samoans | 8.4 /100 | #216 | Tragic 95.4% |
| Immigrants | Eastern Asia | 8.3 /100 | #217 | Tragic 95.4% |
| Dutch West Indians | 8.1 /100 | #218 | Tragic 95.4% |
| Spanish Americans | 8.0 /100 | #219 | Tragic 95.4% |
| Immigrants | Southern Europe | 7.7 /100 | #220 | Tragic 95.3% |
| Immigrants | Syria | 7.4 /100 | #221 | Tragic 95.3% |
| Immigrants | Malaysia | 7.3 /100 | #222 | Tragic 95.3% |
| Immigrants | Oceania | 7.1 /100 | #223 | Tragic 95.3% |
| Immigrants | Western Asia | 6.0 /100 | #224 | Tragic 95.3% |