Dominican vs Argentinean 2nd Grade
COMPARE
Dominican
Argentinean
2nd Grade
2nd Grade Comparison
Dominicans
Argentineans
96.6%
2ND GRADE
0.0/ 100
METRIC RATING
325th/ 347
METRIC RANK
97.9%
2ND GRADE
46.3/ 100
METRIC RATING
178th/ 347
METRIC RANK
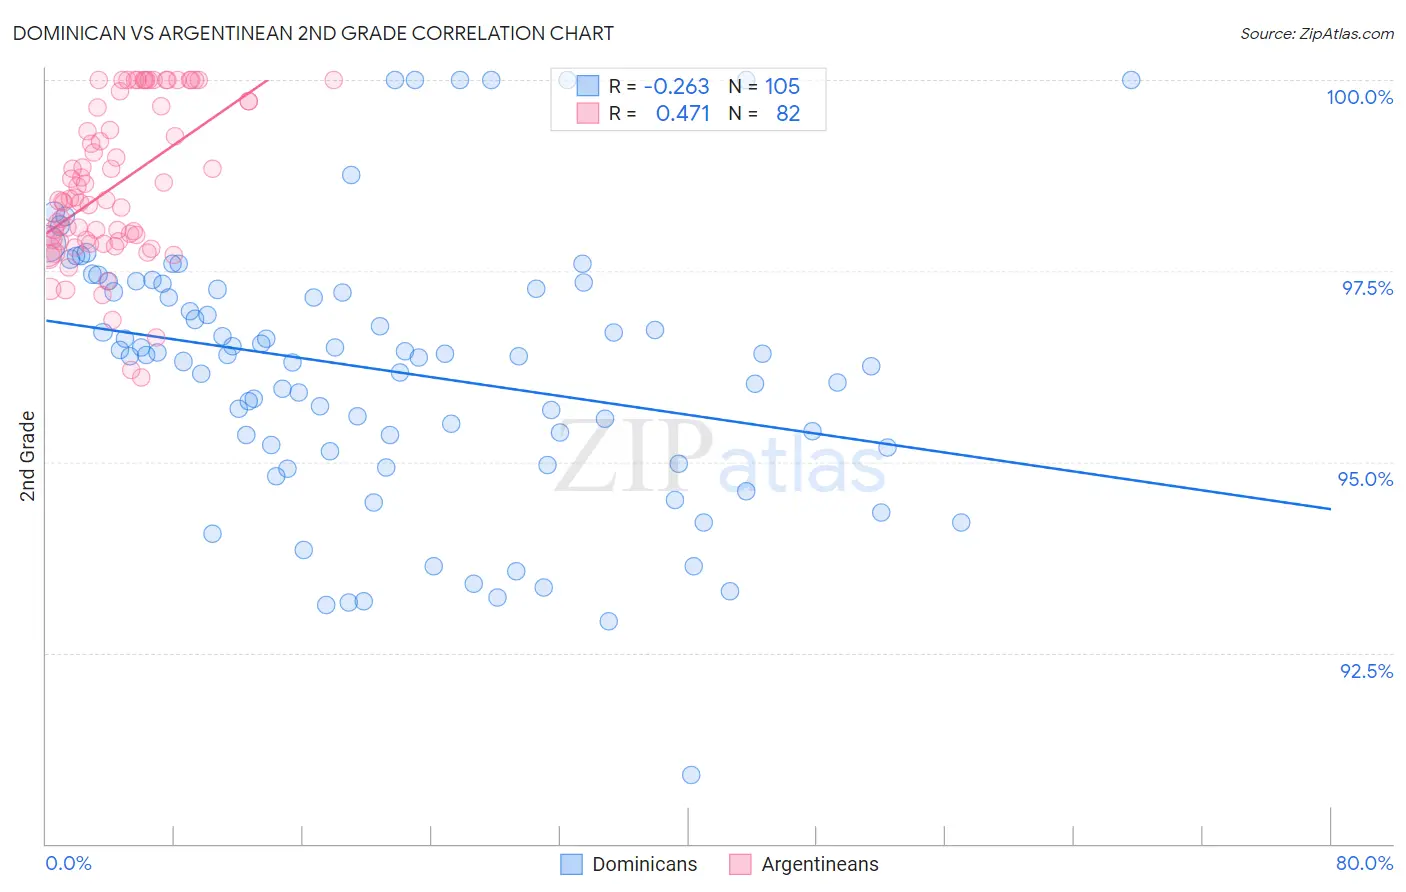
Dominican vs Argentinean 2nd Grade Correlation Chart
The statistical analysis conducted on geographies consisting of 355,142,603 people shows a weak negative correlation between the proportion of Dominicans and percentage of population with at least 2nd grade education in the United States with a correlation coefficient (R) of -0.263 and weighted average of 96.6%. Similarly, the statistical analysis conducted on geographies consisting of 297,146,811 people shows a moderate positive correlation between the proportion of Argentineans and percentage of population with at least 2nd grade education in the United States with a correlation coefficient (R) of 0.471 and weighted average of 97.9%, a difference of 1.3%.
2nd Grade Correlation Summary
| Measurement | Dominican | Argentinean |
| Minimum | 90.9% | 96.1% |
| Maximum | 100.0% | 100.0% |
| Range | 9.1% | 3.9% |
| Mean | 96.2% | 98.6% |
| Median | 96.4% | 98.4% |
| Interquartile 25% (IQ1) | 95.2% | 97.9% |
| Interquartile 75% (IQ3) | 97.3% | 99.7% |
| Interquartile Range (IQR) | 2.1% | 1.8% |
| Standard Deviation (Sample) | 1.8% | 1.0% |
| Standard Deviation (Population) | 1.8% | 1.0% |
Similar Demographics by 2nd Grade
Demographics Similar to Dominicans by 2nd Grade
In terms of 2nd grade, the demographic groups most similar to Dominicans are Immigrants from Honduras (96.6%, a difference of 0.0%), Mexican American Indian (96.7%, a difference of 0.040%), Vietnamese (96.7%, a difference of 0.060%), Immigrants from Bangladesh (96.7%, a difference of 0.090%), and Immigrants from Vietnam (96.5%, a difference of 0.090%).
| Demographics | Rating | Rank | 2nd Grade |
| Indonesians | 0.0 /100 | #318 | Tragic 96.7% |
| Immigrants | Nicaragua | 0.0 /100 | #319 | Tragic 96.7% |
| Immigrants | Guyana | 0.0 /100 | #320 | Tragic 96.7% |
| Immigrants | Burma/Myanmar | 0.0 /100 | #321 | Tragic 96.7% |
| Immigrants | Bangladesh | 0.0 /100 | #322 | Tragic 96.7% |
| Vietnamese | 0.0 /100 | #323 | Tragic 96.7% |
| Mexican American Indians | 0.0 /100 | #324 | Tragic 96.7% |
| Dominicans | 0.0 /100 | #325 | Tragic 96.6% |
| Immigrants | Honduras | 0.0 /100 | #326 | Tragic 96.6% |
| Immigrants | Vietnam | 0.0 /100 | #327 | Tragic 96.5% |
| Mexicans | 0.0 /100 | #328 | Tragic 96.5% |
| Japanese | 0.0 /100 | #329 | Tragic 96.5% |
| Immigrants | Latin America | 0.0 /100 | #330 | Tragic 96.5% |
| Immigrants | Armenia | 0.0 /100 | #331 | Tragic 96.5% |
| Bangladeshis | 0.0 /100 | #332 | Tragic 96.5% |
Demographics Similar to Argentineans by 2nd Grade
In terms of 2nd grade, the demographic groups most similar to Argentineans are Immigrants from Brazil (97.9%, a difference of 0.0%), Immigrants from Venezuela (97.9%, a difference of 0.0%), Immigrants from Micronesia (97.9%, a difference of 0.010%), Immigrants from Bosnia and Herzegovina (97.9%, a difference of 0.010%), and Immigrants from Sri Lanka (97.9%, a difference of 0.010%).
| Demographics | Rating | Rank | 2nd Grade |
| Albanians | 52.8 /100 | #171 | Average 97.9% |
| Immigrants | Korea | 52.7 /100 | #172 | Average 97.9% |
| Kenyans | 52.7 /100 | #173 | Average 97.9% |
| Immigrants | Micronesia | 50.0 /100 | #174 | Average 97.9% |
| Immigrants | Bosnia and Herzegovina | 49.8 /100 | #175 | Average 97.9% |
| Immigrants | Sri Lanka | 48.7 /100 | #176 | Average 97.9% |
| Immigrants | Brazil | 46.6 /100 | #177 | Average 97.9% |
| Argentineans | 46.3 /100 | #178 | Average 97.9% |
| Immigrants | Venezuela | 46.1 /100 | #179 | Average 97.9% |
| Natives/Alaskans | 44.3 /100 | #180 | Average 97.9% |
| Egyptians | 44.3 /100 | #181 | Average 97.9% |
| Portuguese | 42.4 /100 | #182 | Average 97.8% |
| Immigrants | Poland | 42.2 /100 | #183 | Average 97.8% |
| Immigrants | Belarus | 41.5 /100 | #184 | Average 97.8% |
| Immigrants | Argentina | 40.6 /100 | #185 | Average 97.8% |