Danish vs New Zealander 10th Grade
COMPARE
Danish
New Zealander
10th Grade
10th Grade Comparison
Danes
New Zealanders
95.7%
10TH GRADE
100.0/ 100
METRIC RATING
11th/ 347
METRIC RANK
95.0%
10TH GRADE
99.8/ 100
METRIC RATING
56th/ 347
METRIC RANK
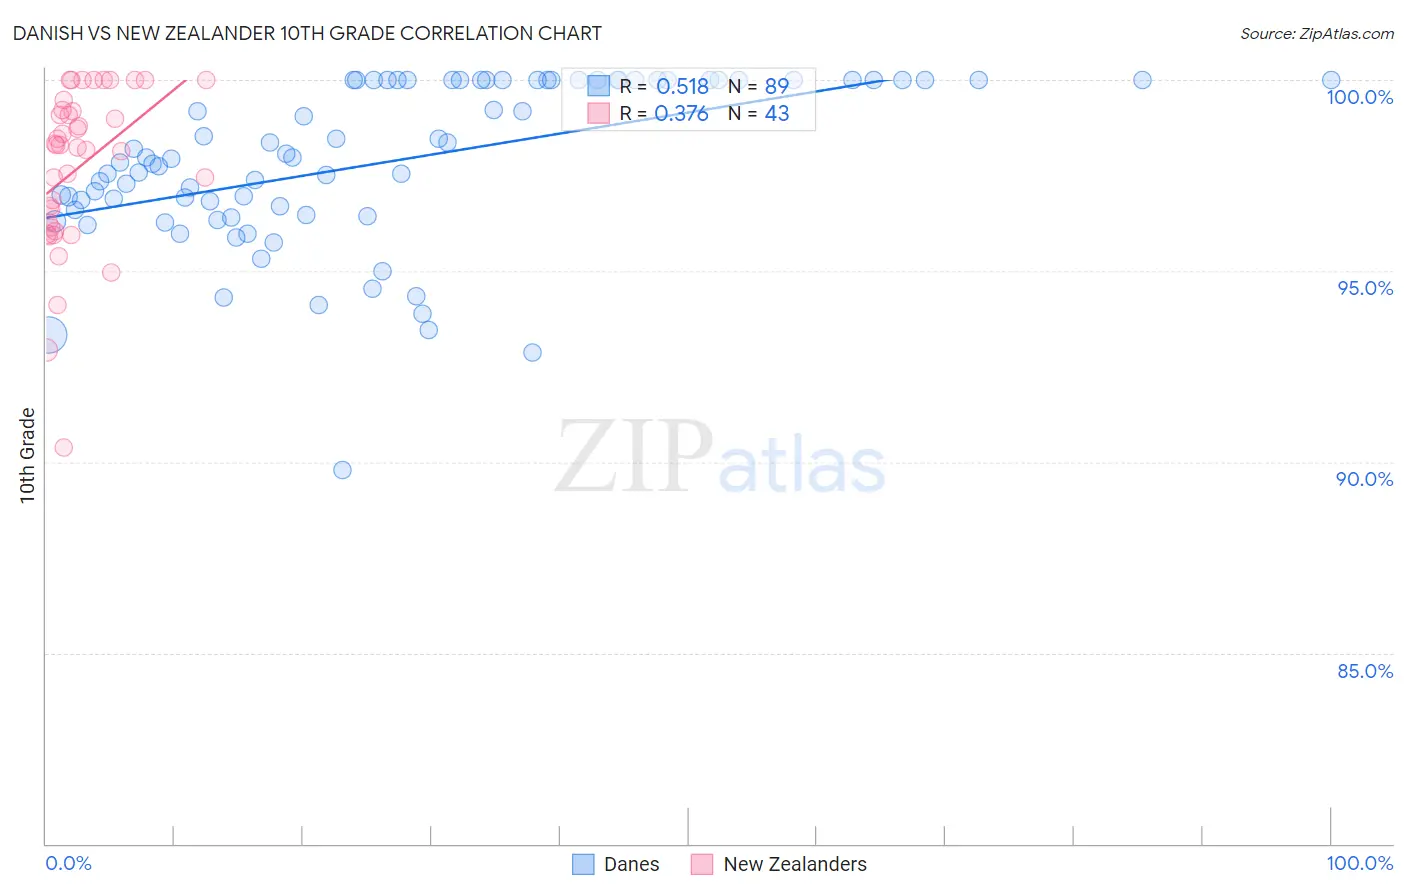
Danish vs New Zealander 10th Grade Correlation Chart
The statistical analysis conducted on geographies consisting of 474,193,335 people shows a substantial positive correlation between the proportion of Danes and percentage of population with at least 10th grade education in the United States with a correlation coefficient (R) of 0.518 and weighted average of 95.7%. Similarly, the statistical analysis conducted on geographies consisting of 106,912,053 people shows a mild positive correlation between the proportion of New Zealanders and percentage of population with at least 10th grade education in the United States with a correlation coefficient (R) of 0.376 and weighted average of 95.0%, a difference of 0.71%.
10th Grade Correlation Summary
| Measurement | Danish | New Zealander |
| Minimum | 89.8% | 90.4% |
| Maximum | 100.0% | 100.0% |
| Range | 10.2% | 9.6% |
| Mean | 97.9% | 97.7% |
| Median | 98.0% | 98.3% |
| Interquartile 25% (IQ1) | 96.5% | 96.1% |
| Interquartile 75% (IQ3) | 100.0% | 99.2% |
| Interquartile Range (IQR) | 3.5% | 3.1% |
| Standard Deviation (Sample) | 2.2% | 2.1% |
| Standard Deviation (Population) | 2.1% | 2.1% |
Similar Demographics by 10th Grade
Demographics Similar to Danes by 10th Grade
In terms of 10th grade, the demographic groups most similar to Danes are Croatian (95.7%, a difference of 0.040%), Tlingit-Haida (95.7%, a difference of 0.040%), Finnish (95.8%, a difference of 0.060%), English (95.6%, a difference of 0.080%), and Tsimshian (95.6%, a difference of 0.090%).
| Demographics | Rating | Rank | 10th Grade |
| Swedes | 100.0 /100 | #4 | Exceptional 95.9% |
| Carpatho Rusyns | 100.0 /100 | #5 | Exceptional 95.9% |
| Poles | 100.0 /100 | #6 | Exceptional 95.8% |
| Germans | 100.0 /100 | #7 | Exceptional 95.8% |
| Lithuanians | 100.0 /100 | #8 | Exceptional 95.8% |
| Finns | 100.0 /100 | #9 | Exceptional 95.8% |
| Croatians | 100.0 /100 | #10 | Exceptional 95.7% |
| Danes | 100.0 /100 | #11 | Exceptional 95.7% |
| Tlingit-Haida | 100.0 /100 | #12 | Exceptional 95.7% |
| English | 100.0 /100 | #13 | Exceptional 95.6% |
| Tsimshian | 100.0 /100 | #14 | Exceptional 95.6% |
| Irish | 100.0 /100 | #15 | Exceptional 95.6% |
| Scottish | 100.0 /100 | #16 | Exceptional 95.6% |
| Latvians | 100.0 /100 | #17 | Exceptional 95.6% |
| Italians | 100.0 /100 | #18 | Exceptional 95.6% |
Demographics Similar to New Zealanders by 10th Grade
In terms of 10th grade, the demographic groups most similar to New Zealanders are Immigrants from Ireland (95.0%, a difference of 0.0%), Ukrainian (95.0%, a difference of 0.0%), Aleut (95.0%, a difference of 0.010%), Celtic (95.0%, a difference of 0.010%), and Immigrants from Lithuania (95.0%, a difference of 0.020%).
| Demographics | Rating | Rank | 10th Grade |
| Immigrants | Austria | 99.9 /100 | #49 | Exceptional 95.1% |
| Immigrants | Canada | 99.8 /100 | #50 | Exceptional 95.1% |
| Austrians | 99.8 /100 | #51 | Exceptional 95.1% |
| Ottawa | 99.8 /100 | #52 | Exceptional 95.1% |
| Immigrants | North America | 99.8 /100 | #53 | Exceptional 95.0% |
| Immigrants | Lithuania | 99.8 /100 | #54 | Exceptional 95.0% |
| Immigrants | Ireland | 99.8 /100 | #55 | Exceptional 95.0% |
| New Zealanders | 99.8 /100 | #56 | Exceptional 95.0% |
| Ukrainians | 99.8 /100 | #57 | Exceptional 95.0% |
| Aleuts | 99.8 /100 | #58 | Exceptional 95.0% |
| Celtics | 99.8 /100 | #59 | Exceptional 95.0% |
| Cypriots | 99.8 /100 | #60 | Exceptional 95.0% |
| Chippewa | 99.8 /100 | #61 | Exceptional 95.0% |
| Thais | 99.8 /100 | #62 | Exceptional 95.0% |
| Immigrants | Singapore | 99.8 /100 | #63 | Exceptional 95.0% |