Danish vs Delaware 12th Grade, No Diploma
COMPARE
Danish
Delaware
12th Grade, No Diploma
12th Grade, No Diploma Comparison
Danes
Delaware
93.5%
12TH GRADE, NO DIPLOMA
100.0/ 100
METRIC RATING
13th/ 347
METRIC RANK
91.2%
12TH GRADE, NO DIPLOMA
52.8/ 100
METRIC RATING
170th/ 347
METRIC RANK
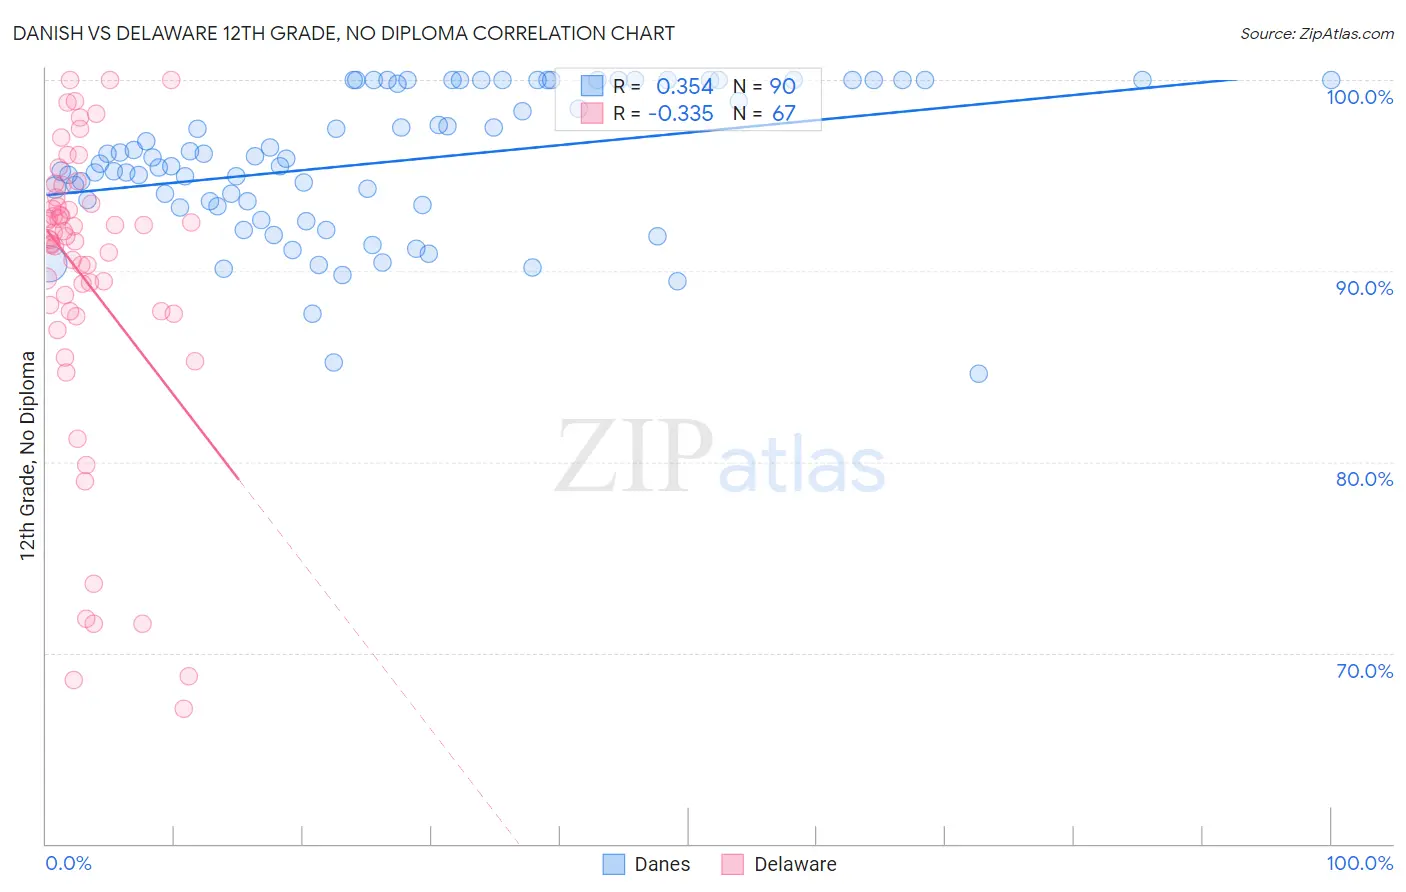
Danish vs Delaware 12th Grade, No Diploma Correlation Chart
The statistical analysis conducted on geographies consisting of 474,193,674 people shows a mild positive correlation between the proportion of Danes and percentage of population with at least 12th grade (no diploma) education in the United States with a correlation coefficient (R) of 0.354 and weighted average of 93.5%. Similarly, the statistical analysis conducted on geographies consisting of 96,234,866 people shows a mild negative correlation between the proportion of Delaware and percentage of population with at least 12th grade (no diploma) education in the United States with a correlation coefficient (R) of -0.335 and weighted average of 91.2%, a difference of 2.5%.
12th Grade, No Diploma Correlation Summary
| Measurement | Danish | Delaware |
| Minimum | 84.6% | 67.1% |
| Maximum | 100.0% | 100.0% |
| Range | 15.4% | 32.9% |
| Mean | 95.7% | 89.6% |
| Median | 95.7% | 91.7% |
| Interquartile 25% (IQ1) | 93.4% | 87.9% |
| Interquartile 75% (IQ3) | 100.0% | 93.5% |
| Interquartile Range (IQR) | 6.6% | 5.6% |
| Standard Deviation (Sample) | 3.7% | 7.9% |
| Standard Deviation (Population) | 3.7% | 7.9% |
Similar Demographics by 12th Grade, No Diploma
Demographics Similar to Danes by 12th Grade, No Diploma
In terms of 12th grade, no diploma, the demographic groups most similar to Danes are Eastern European (93.5%, a difference of 0.020%), Bulgarian (93.5%, a difference of 0.020%), Polish (93.5%, a difference of 0.030%), Croatian (93.5%, a difference of 0.090%), and Latvian (93.6%, a difference of 0.11%).
| Demographics | Rating | Rank | 12th Grade, No Diploma |
| Immigrants | India | 100.0 /100 | #6 | Exceptional 93.6% |
| Slovaks | 100.0 /100 | #7 | Exceptional 93.6% |
| Chinese | 100.0 /100 | #8 | Exceptional 93.6% |
| Latvians | 100.0 /100 | #9 | Exceptional 93.6% |
| Croatians | 100.0 /100 | #10 | Exceptional 93.5% |
| Poles | 100.0 /100 | #11 | Exceptional 93.5% |
| Eastern Europeans | 100.0 /100 | #12 | Exceptional 93.5% |
| Danes | 100.0 /100 | #13 | Exceptional 93.5% |
| Bulgarians | 100.0 /100 | #14 | Exceptional 93.5% |
| Finns | 100.0 /100 | #15 | Exceptional 93.4% |
| Maltese | 100.0 /100 | #16 | Exceptional 93.3% |
| Luxembourgers | 100.0 /100 | #17 | Exceptional 93.3% |
| Immigrants | Singapore | 99.9 /100 | #18 | Exceptional 93.3% |
| Germans | 99.9 /100 | #19 | Exceptional 93.3% |
| Filipinos | 99.9 /100 | #20 | Exceptional 93.2% |
Demographics Similar to Delaware by 12th Grade, No Diploma
In terms of 12th grade, no diploma, the demographic groups most similar to Delaware are Immigrants from Morocco (91.2%, a difference of 0.020%), Bermudan (91.2%, a difference of 0.020%), Immigrants from Indonesia (91.2%, a difference of 0.030%), Bolivian (91.2%, a difference of 0.030%), and Immigrants from Nepal (91.2%, a difference of 0.030%).
| Demographics | Rating | Rank | 12th Grade, No Diploma |
| Immigrants | Asia | 61.5 /100 | #163 | Good 91.3% |
| Immigrants | China | 60.9 /100 | #164 | Good 91.3% |
| Alsatians | 58.3 /100 | #165 | Average 91.3% |
| Hmong | 58.0 /100 | #166 | Average 91.3% |
| Immigrants | Malaysia | 57.8 /100 | #167 | Average 91.3% |
| Cree | 57.0 /100 | #168 | Average 91.2% |
| Immigrants | Indonesia | 54.9 /100 | #169 | Average 91.2% |
| Delaware | 52.8 /100 | #170 | Average 91.2% |
| Immigrants | Morocco | 51.4 /100 | #171 | Average 91.2% |
| Bermudans | 50.8 /100 | #172 | Average 91.2% |
| Bolivians | 50.4 /100 | #173 | Average 91.2% |
| Immigrants | Nepal | 50.0 /100 | #174 | Average 91.2% |
| Immigrants | Western Asia | 49.0 /100 | #175 | Average 91.2% |
| Iroquois | 48.5 /100 | #176 | Average 91.1% |
| Sierra Leoneans | 47.7 /100 | #177 | Average 91.1% |