Czech vs Immigrants from Uzbekistan Nursery School
COMPARE
Czech
Immigrants from Uzbekistan
Nursery School
Nursery School Comparison
Czechs
Immigrants from Uzbekistan
98.6%
NURSERY SCHOOL
100.0/ 100
METRIC RATING
31st/ 347
METRIC RANK
97.4%
NURSERY SCHOOL
0.1/ 100
METRIC RATING
278th/ 347
METRIC RANK
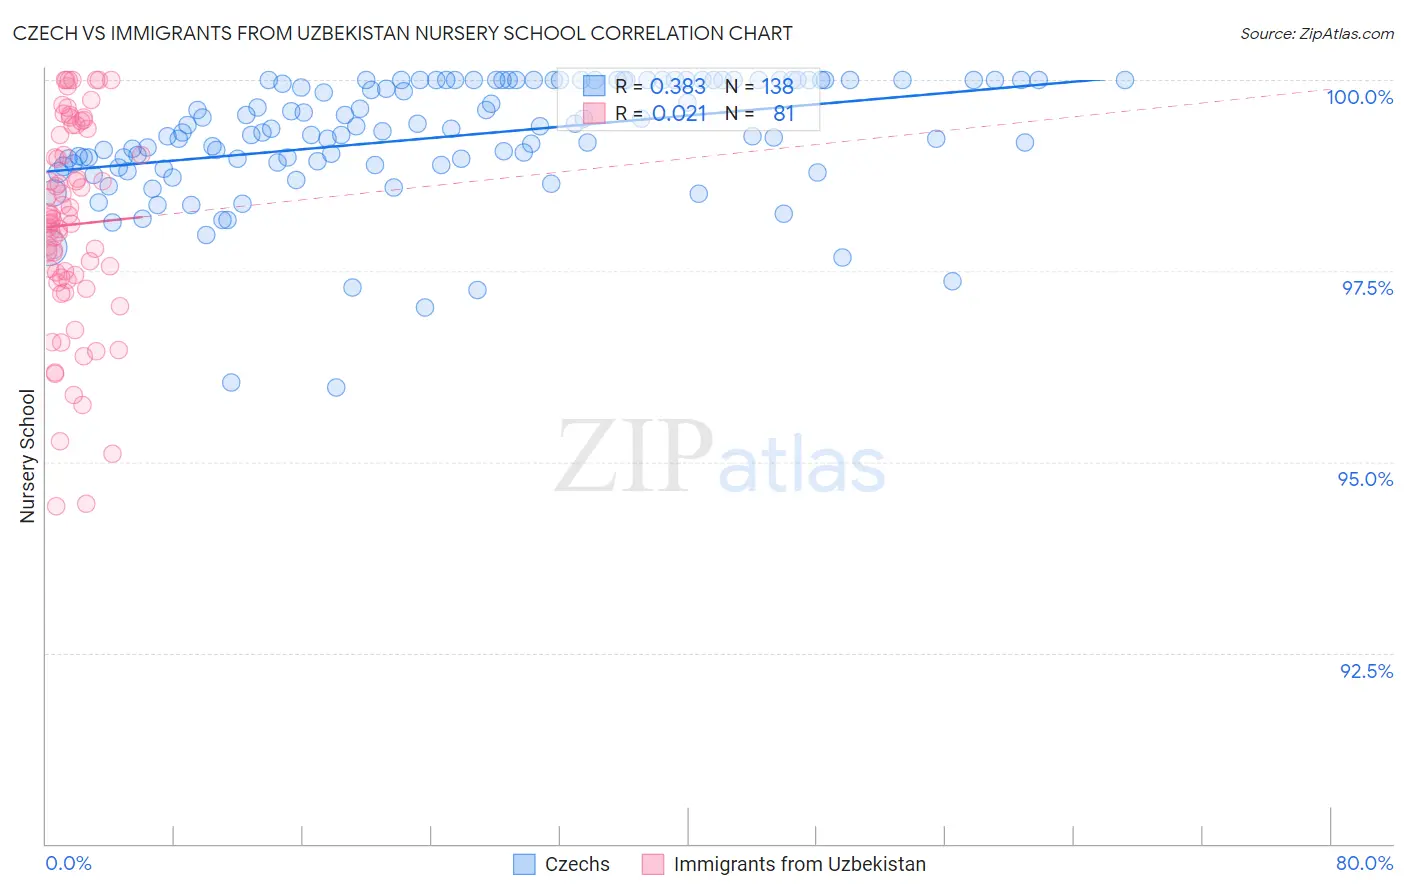
Czech vs Immigrants from Uzbekistan Nursery School Correlation Chart
The statistical analysis conducted on geographies consisting of 484,813,102 people shows a mild positive correlation between the proportion of Czechs and percentage of population with at least nursery school education in the United States with a correlation coefficient (R) of 0.383 and weighted average of 98.6%. Similarly, the statistical analysis conducted on geographies consisting of 118,593,934 people shows no correlation between the proportion of Immigrants from Uzbekistan and percentage of population with at least nursery school education in the United States with a correlation coefficient (R) of 0.021 and weighted average of 97.4%, a difference of 1.2%.
Nursery School Correlation Summary
| Measurement | Czech | Immigrants from Uzbekistan |
| Minimum | 96.0% | 94.4% |
| Maximum | 100.0% | 100.0% |
| Range | 4.0% | 5.6% |
| Mean | 99.2% | 98.1% |
| Median | 99.3% | 98.2% |
| Interquartile 25% (IQ1) | 98.9% | 97.4% |
| Interquartile 75% (IQ3) | 100.0% | 99.3% |
| Interquartile Range (IQR) | 1.1% | 1.9% |
| Standard Deviation (Sample) | 0.79% | 1.3% |
| Standard Deviation (Population) | 0.79% | 1.3% |
Similar Demographics by Nursery School
Demographics Similar to Czechs by Nursery School
In terms of nursery school, the demographic groups most similar to Czechs are European (98.6%, a difference of 0.0%), French Canadian (98.6%, a difference of 0.0%), French (98.6%, a difference of 0.010%), Scandinavian (98.6%, a difference of 0.010%), and Croatian (98.6%, a difference of 0.020%).
| Demographics | Rating | Rank | Nursery School |
| Danes | 100.0 /100 | #24 | Exceptional 98.6% |
| Scotch-Irish | 100.0 /100 | #25 | Exceptional 98.6% |
| Sioux | 100.0 /100 | #26 | Exceptional 98.6% |
| Arapaho | 100.0 /100 | #27 | Exceptional 98.6% |
| Croatians | 100.0 /100 | #28 | Exceptional 98.6% |
| French | 100.0 /100 | #29 | Exceptional 98.6% |
| Europeans | 100.0 /100 | #30 | Exceptional 98.6% |
| Czechs | 100.0 /100 | #31 | Exceptional 98.6% |
| French Canadians | 100.0 /100 | #32 | Exceptional 98.6% |
| Scandinavians | 100.0 /100 | #33 | Exceptional 98.6% |
| Chinese | 100.0 /100 | #34 | Exceptional 98.6% |
| Swiss | 100.0 /100 | #35 | Exceptional 98.6% |
| British | 100.0 /100 | #36 | Exceptional 98.5% |
| Lumbee | 99.9 /100 | #37 | Exceptional 98.5% |
| Italians | 99.9 /100 | #38 | Exceptional 98.5% |
Demographics Similar to Immigrants from Uzbekistan by Nursery School
In terms of nursery school, the demographic groups most similar to Immigrants from Uzbekistan are Immigrants from Western Africa (97.4%, a difference of 0.010%), Immigrants from Ghana (97.4%, a difference of 0.010%), Barbadian (97.4%, a difference of 0.010%), Trinidadian and Tobagonian (97.4%, a difference of 0.010%), and Afghan (97.4%, a difference of 0.020%).
| Demographics | Rating | Rank | Nursery School |
| Immigrants | Peru | 0.2 /100 | #271 | Tragic 97.5% |
| Immigrants | Bolivia | 0.1 /100 | #272 | Tragic 97.5% |
| Immigrants | China | 0.1 /100 | #273 | Tragic 97.5% |
| Immigrants | Cameroon | 0.1 /100 | #274 | Tragic 97.5% |
| Ghanaians | 0.1 /100 | #275 | Tragic 97.5% |
| Immigrants | Philippines | 0.1 /100 | #276 | Tragic 97.5% |
| Immigrants | Western Africa | 0.1 /100 | #277 | Tragic 97.4% |
| Immigrants | Uzbekistan | 0.1 /100 | #278 | Tragic 97.4% |
| Immigrants | Ghana | 0.1 /100 | #279 | Tragic 97.4% |
| Barbadians | 0.0 /100 | #280 | Tragic 97.4% |
| Trinidadians and Tobagonians | 0.0 /100 | #281 | Tragic 97.4% |
| Afghans | 0.0 /100 | #282 | Tragic 97.4% |
| Immigrants | West Indies | 0.0 /100 | #283 | Tragic 97.4% |
| Immigrants | Trinidad and Tobago | 0.0 /100 | #284 | Tragic 97.4% |
| Immigrants | Barbados | 0.0 /100 | #285 | Tragic 97.4% |