Czech vs Immigrants from Latin America 4th Grade
COMPARE
Czech
Immigrants from Latin America
4th Grade
4th Grade Comparison
Czechs
Immigrants from Latin America
98.3%
4TH GRADE
100.0/ 100
METRIC RATING
29th/ 347
METRIC RANK
95.7%
4TH GRADE
0.0/ 100
METRIC RATING
335th/ 347
METRIC RANK
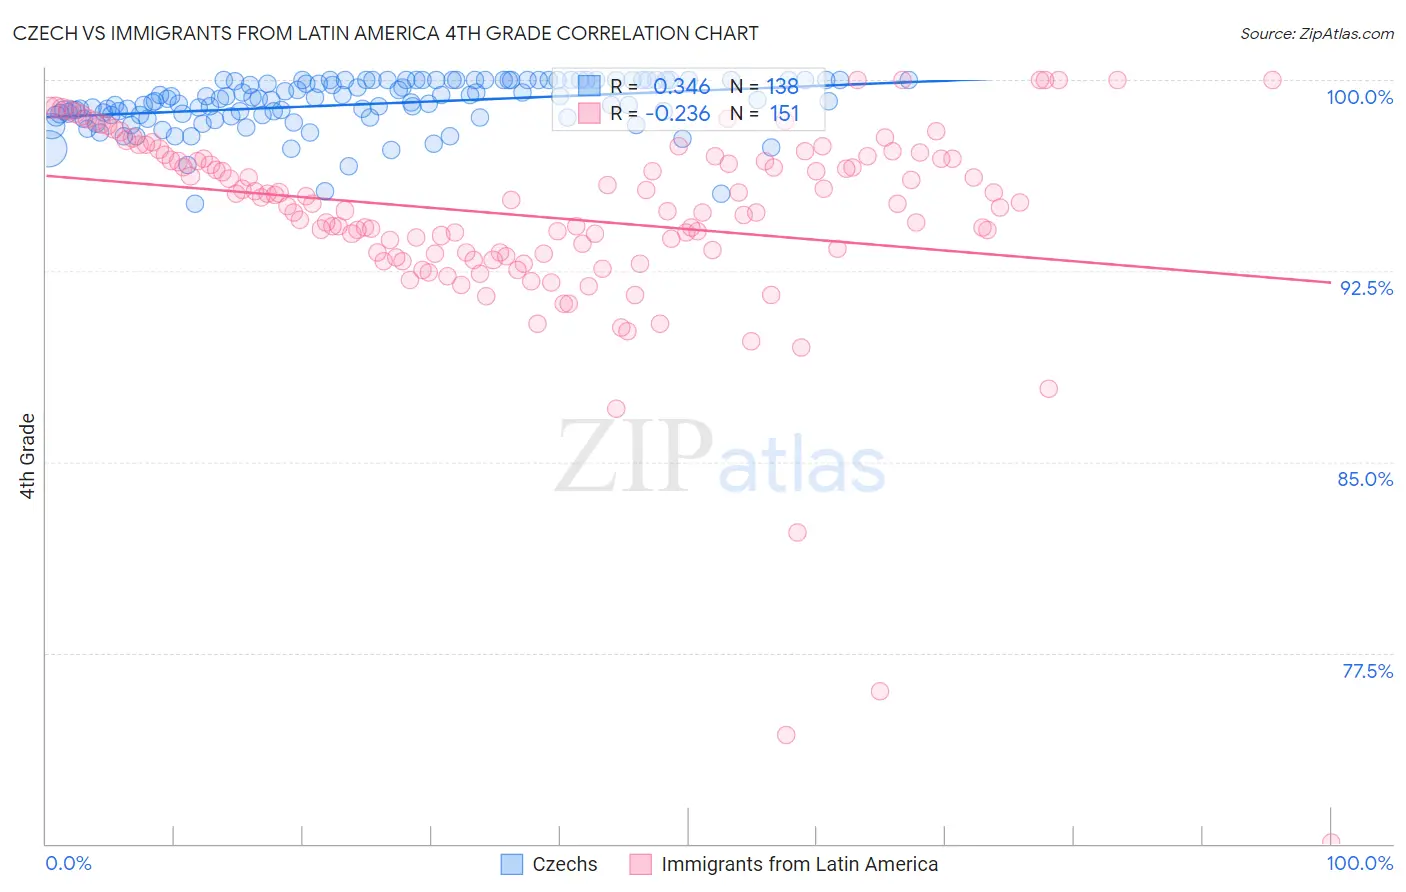
Czech vs Immigrants from Latin America 4th Grade Correlation Chart
The statistical analysis conducted on geographies consisting of 484,805,686 people shows a mild positive correlation between the proportion of Czechs and percentage of population with at least 4th grade education in the United States with a correlation coefficient (R) of 0.346 and weighted average of 98.3%. Similarly, the statistical analysis conducted on geographies consisting of 558,652,919 people shows a weak negative correlation between the proportion of Immigrants from Latin America and percentage of population with at least 4th grade education in the United States with a correlation coefficient (R) of -0.236 and weighted average of 95.7%, a difference of 2.8%.
4th Grade Correlation Summary
| Measurement | Czech | Immigrants from Latin America |
| Minimum | 95.1% | 70.0% |
| Maximum | 100.0% | 100.0% |
| Range | 4.9% | 30.0% |
| Mean | 99.0% | 94.6% |
| Median | 99.2% | 95.1% |
| Interquartile 25% (IQ1) | 98.6% | 93.2% |
| Interquartile 75% (IQ3) | 100.0% | 96.9% |
| Interquartile Range (IQR) | 1.4% | 3.7% |
| Standard Deviation (Sample) | 0.98% | 4.1% |
| Standard Deviation (Population) | 0.98% | 4.1% |
Similar Demographics by 4th Grade
Demographics Similar to Czechs by 4th Grade
In terms of 4th grade, the demographic groups most similar to Czechs are French Canadian (98.3%, a difference of 0.010%), French (98.3%, a difference of 0.010%), Scandinavian (98.3%, a difference of 0.010%), European (98.3%, a difference of 0.010%), and Croatian (98.3%, a difference of 0.020%).
| Demographics | Rating | Rank | 4th Grade |
| Finns | 100.0 /100 | #22 | Exceptional 98.3% |
| Sioux | 100.0 /100 | #23 | Exceptional 98.3% |
| Danes | 100.0 /100 | #24 | Exceptional 98.3% |
| Scotch-Irish | 100.0 /100 | #25 | Exceptional 98.3% |
| Croatians | 100.0 /100 | #26 | Exceptional 98.3% |
| French Canadians | 100.0 /100 | #27 | Exceptional 98.3% |
| French | 100.0 /100 | #28 | Exceptional 98.3% |
| Czechs | 100.0 /100 | #29 | Exceptional 98.3% |
| Scandinavians | 100.0 /100 | #30 | Exceptional 98.3% |
| Europeans | 100.0 /100 | #31 | Exceptional 98.3% |
| Chinese | 100.0 /100 | #32 | Exceptional 98.3% |
| Swiss | 100.0 /100 | #33 | Exceptional 98.2% |
| Chippewa | 100.0 /100 | #34 | Exceptional 98.2% |
| Italians | 100.0 /100 | #35 | Exceptional 98.2% |
| British | 100.0 /100 | #36 | Exceptional 98.2% |
Demographics Similar to Immigrants from Latin America by 4th Grade
In terms of 4th grade, the demographic groups most similar to Immigrants from Latin America are Immigrants from Cabo Verde (95.7%, a difference of 0.060%), Immigrants from Dominican Republic (95.7%, a difference of 0.070%), Mexican (95.6%, a difference of 0.070%), Immigrants from Honduras (95.8%, a difference of 0.11%), and Immigrants from Armenia (95.8%, a difference of 0.13%).
| Demographics | Rating | Rank | 4th Grade |
| Mexican American Indians | 0.0 /100 | #328 | Tragic 95.8% |
| Immigrants | Cambodia | 0.0 /100 | #329 | Tragic 95.8% |
| Immigrants | Fiji | 0.0 /100 | #330 | Tragic 95.8% |
| Immigrants | Armenia | 0.0 /100 | #331 | Tragic 95.8% |
| Immigrants | Honduras | 0.0 /100 | #332 | Tragic 95.8% |
| Immigrants | Dominican Republic | 0.0 /100 | #333 | Tragic 95.7% |
| Immigrants | Cabo Verde | 0.0 /100 | #334 | Tragic 95.7% |
| Immigrants | Latin America | 0.0 /100 | #335 | Tragic 95.7% |
| Mexicans | 0.0 /100 | #336 | Tragic 95.6% |
| Central Americans | 0.0 /100 | #337 | Tragic 95.5% |
| Nepalese | 0.0 /100 | #338 | Tragic 95.5% |
| Guatemalans | 0.0 /100 | #339 | Tragic 95.3% |
| Yakama | 0.0 /100 | #340 | Tragic 95.2% |
| Immigrants | Yemen | 0.0 /100 | #341 | Tragic 95.2% |
| Immigrants | Central America | 0.0 /100 | #342 | Tragic 95.1% |