Czech vs Arab 6th Grade
COMPARE
Czech
Arab
6th Grade
6th Grade Comparison
Czechs
Arabs
98.0%
6TH GRADE
100.0/ 100
METRIC RATING
26th/ 347
METRIC RANK
97.0%
6TH GRADE
50.1/ 100
METRIC RATING
173rd/ 347
METRIC RANK
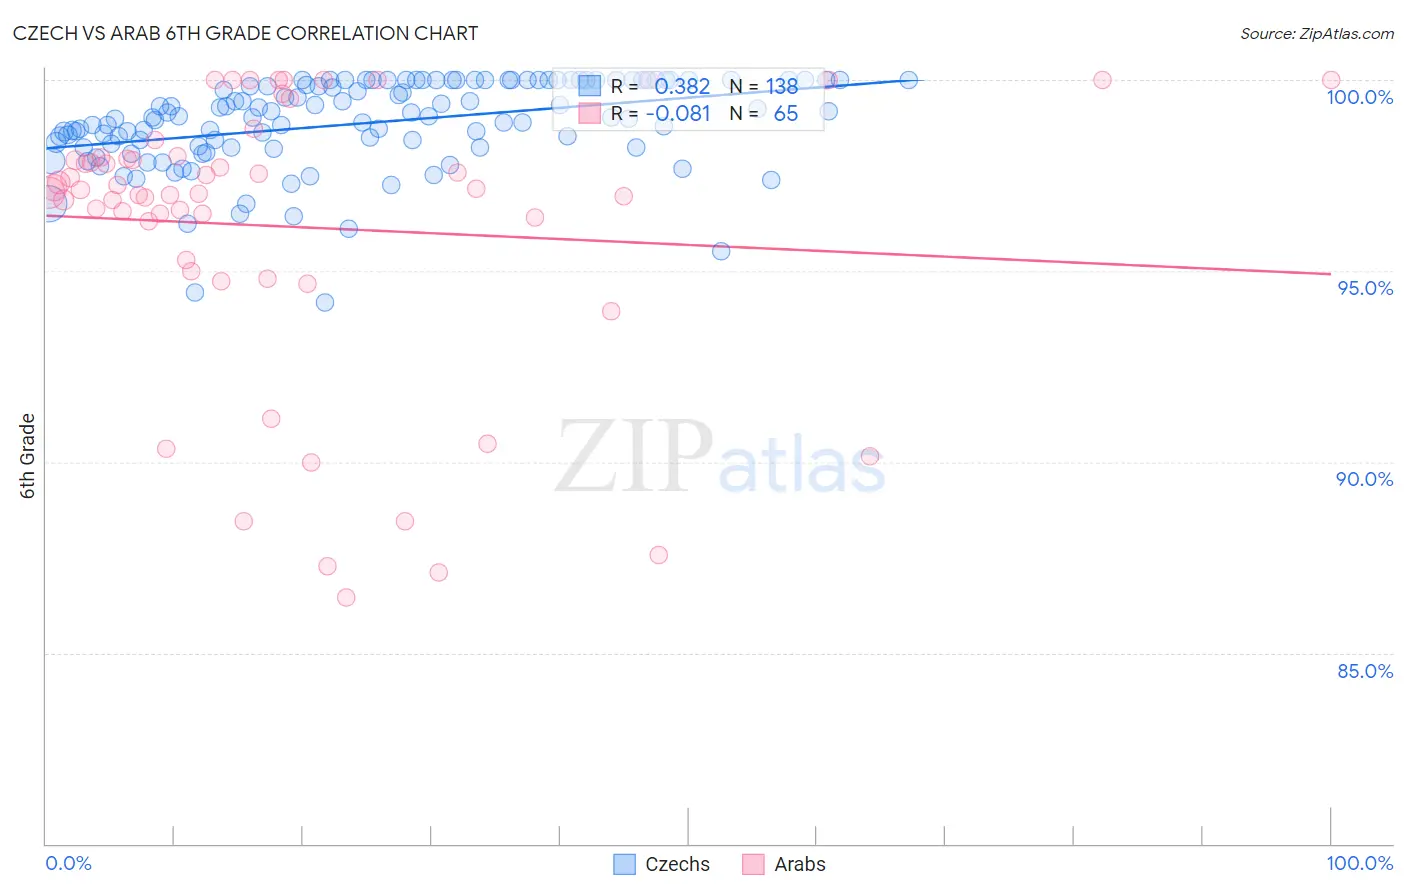
Czech vs Arab 6th Grade Correlation Chart
The statistical analysis conducted on geographies consisting of 484,805,686 people shows a mild positive correlation between the proportion of Czechs and percentage of population with at least 6th grade education in the United States with a correlation coefficient (R) of 0.382 and weighted average of 98.0%. Similarly, the statistical analysis conducted on geographies consisting of 486,871,007 people shows a slight negative correlation between the proportion of Arabs and percentage of population with at least 6th grade education in the United States with a correlation coefficient (R) of -0.081 and weighted average of 97.0%, a difference of 0.99%.
6th Grade Correlation Summary
| Measurement | Czech | Arab |
| Minimum | 94.2% | 86.5% |
| Maximum | 100.0% | 100.0% |
| Range | 5.8% | 13.5% |
| Mean | 98.9% | 96.2% |
| Median | 99.0% | 97.1% |
| Interquartile 25% (IQ1) | 98.2% | 95.1% |
| Interquartile 75% (IQ3) | 100.0% | 98.0% |
| Interquartile Range (IQR) | 1.8% | 2.8% |
| Standard Deviation (Sample) | 1.2% | 3.7% |
| Standard Deviation (Population) | 1.2% | 3.7% |
Similar Demographics by 6th Grade
Demographics Similar to Czechs by 6th Grade
In terms of 6th grade, the demographic groups most similar to Czechs are Yup'ik (98.0%, a difference of 0.0%), Scandinavian (98.0%, a difference of 0.0%), Scotch-Irish (98.0%, a difference of 0.010%), French (98.0%, a difference of 0.010%), and Croatian (98.0%, a difference of 0.020%).
| Demographics | Rating | Rank | 6th Grade |
| Irish | 100.0 /100 | #19 | Exceptional 98.1% |
| Finns | 100.0 /100 | #20 | Exceptional 98.1% |
| Lithuanians | 100.0 /100 | #21 | Exceptional 98.1% |
| Danes | 100.0 /100 | #22 | Exceptional 98.0% |
| Sioux | 100.0 /100 | #23 | Exceptional 98.0% |
| Croatians | 100.0 /100 | #24 | Exceptional 98.0% |
| Scotch-Irish | 100.0 /100 | #25 | Exceptional 98.0% |
| Czechs | 100.0 /100 | #26 | Exceptional 98.0% |
| Yup'ik | 100.0 /100 | #27 | Exceptional 98.0% |
| Scandinavians | 100.0 /100 | #28 | Exceptional 98.0% |
| French | 100.0 /100 | #29 | Exceptional 98.0% |
| French Canadians | 100.0 /100 | #30 | Exceptional 98.0% |
| Europeans | 100.0 /100 | #31 | Exceptional 98.0% |
| Alaska Natives | 100.0 /100 | #32 | Exceptional 98.0% |
| Chippewa | 100.0 /100 | #33 | Exceptional 97.9% |
Demographics Similar to Arabs by 6th Grade
In terms of 6th grade, the demographic groups most similar to Arabs are Egyptian (97.1%, a difference of 0.0%), Venezuelan (97.0%, a difference of 0.0%), Bermudan (97.1%, a difference of 0.010%), Chilean (97.1%, a difference of 0.010%), and Immigrants from Sri Lanka (97.1%, a difference of 0.010%).
| Demographics | Rating | Rank | 6th Grade |
| Immigrants | Italy | 53.8 /100 | #166 | Average 97.1% |
| Apache | 53.6 /100 | #167 | Average 97.1% |
| Immigrants | Taiwan | 53.5 /100 | #168 | Average 97.1% |
| Bermudans | 52.6 /100 | #169 | Average 97.1% |
| Chileans | 52.1 /100 | #170 | Average 97.1% |
| Immigrants | Sri Lanka | 51.7 /100 | #171 | Average 97.1% |
| Egyptians | 50.9 /100 | #172 | Average 97.1% |
| Arabs | 50.1 /100 | #173 | Average 97.0% |
| Venezuelans | 50.0 /100 | #174 | Average 97.0% |
| Immigrants | Kazakhstan | 47.3 /100 | #175 | Average 97.0% |
| Immigrants | Micronesia | 47.1 /100 | #176 | Average 97.0% |
| Mongolians | 46.7 /100 | #177 | Average 97.0% |
| Pakistanis | 46.0 /100 | #178 | Average 97.0% |
| Immigrants | Kenya | 45.3 /100 | #179 | Average 97.0% |
| Immigrants | Spain | 39.9 /100 | #180 | Fair 97.0% |