Cuban vs Paiute 10th Grade
COMPARE
Cuban
Paiute
10th Grade
10th Grade Comparison
Cubans
Paiute
91.5%
10TH GRADE
0.0/ 100
METRIC RATING
298th/ 347
METRIC RANK
92.6%
10TH GRADE
0.4/ 100
METRIC RATING
261st/ 347
METRIC RANK
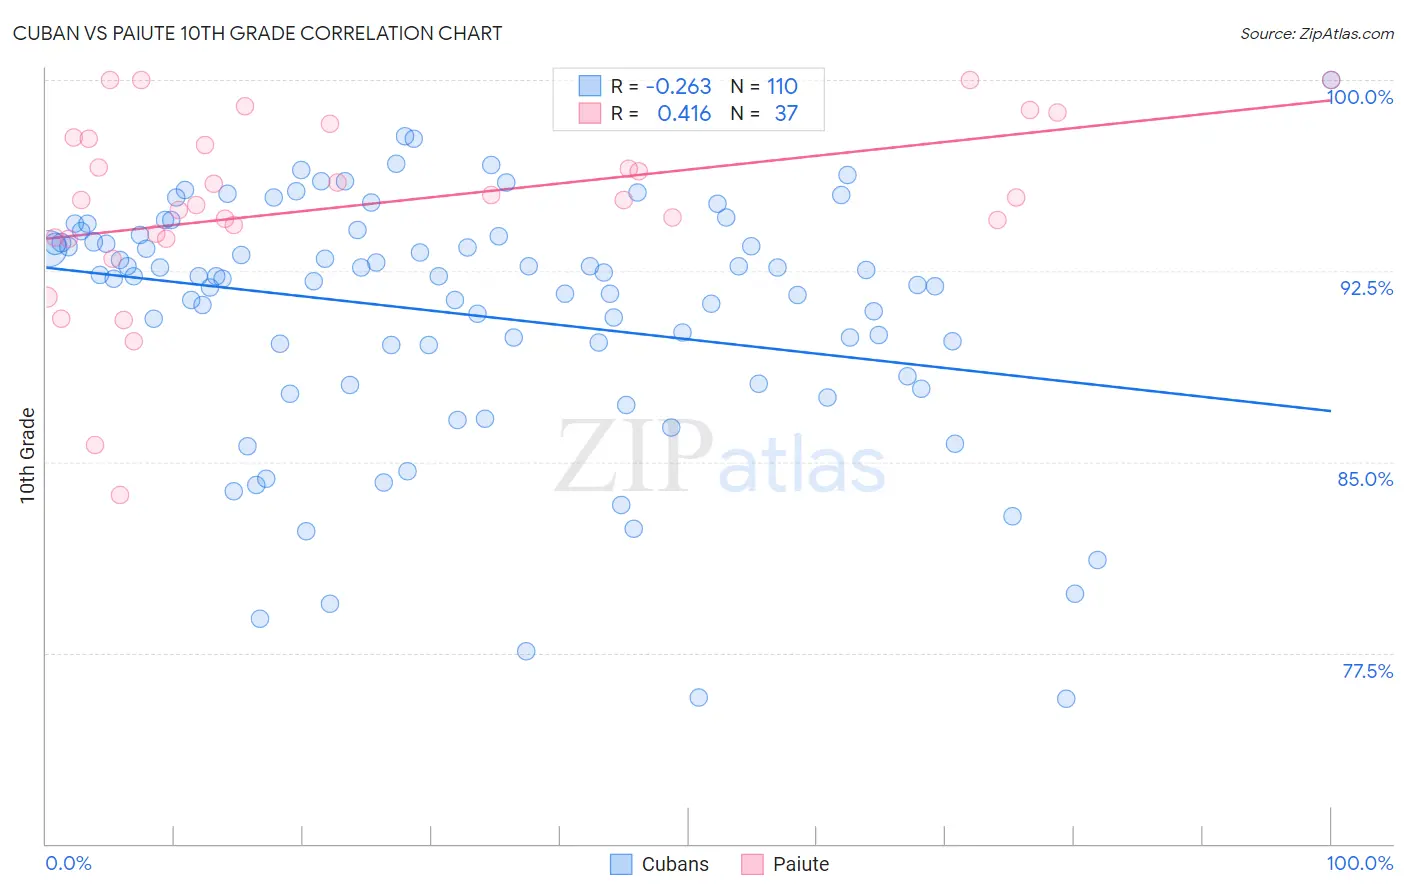
Cuban vs Paiute 10th Grade Correlation Chart
The statistical analysis conducted on geographies consisting of 449,373,052 people shows a weak negative correlation between the proportion of Cubans and percentage of population with at least 10th grade education in the United States with a correlation coefficient (R) of -0.263 and weighted average of 91.5%. Similarly, the statistical analysis conducted on geographies consisting of 58,403,520 people shows a moderate positive correlation between the proportion of Paiute and percentage of population with at least 10th grade education in the United States with a correlation coefficient (R) of 0.416 and weighted average of 92.6%, a difference of 1.2%.
10th Grade Correlation Summary
| Measurement | Cuban | Paiute |
| Minimum | 75.7% | 83.7% |
| Maximum | 100.0% | 100.0% |
| Range | 24.3% | 16.3% |
| Mean | 90.8% | 95.1% |
| Median | 92.3% | 95.3% |
| Interquartile 25% (IQ1) | 88.3% | 93.8% |
| Interquartile 75% (IQ3) | 93.9% | 97.7% |
| Interquartile Range (IQR) | 5.5% | 3.9% |
| Standard Deviation (Sample) | 4.9% | 3.7% |
| Standard Deviation (Population) | 4.9% | 3.6% |
Similar Demographics by 10th Grade
Demographics Similar to Cubans by 10th Grade
In terms of 10th grade, the demographic groups most similar to Cubans are Fijian (91.5%, a difference of 0.020%), Immigrants from Haiti (91.4%, a difference of 0.080%), Guyanese (91.4%, a difference of 0.12%), Immigrants from Grenada (91.6%, a difference of 0.17%), and Japanese (91.2%, a difference of 0.27%).
| Demographics | Rating | Rank | 10th Grade |
| Immigrants | West Indies | 0.0 /100 | #291 | Tragic 91.8% |
| Immigrants | Burma/Myanmar | 0.0 /100 | #292 | Tragic 91.8% |
| Indonesians | 0.0 /100 | #293 | Tragic 91.8% |
| Haitians | 0.0 /100 | #294 | Tragic 91.8% |
| Lumbee | 0.0 /100 | #295 | Tragic 91.7% |
| Immigrants | Grenada | 0.0 /100 | #296 | Tragic 91.6% |
| Fijians | 0.0 /100 | #297 | Tragic 91.5% |
| Cubans | 0.0 /100 | #298 | Tragic 91.5% |
| Immigrants | Haiti | 0.0 /100 | #299 | Tragic 91.4% |
| Guyanese | 0.0 /100 | #300 | Tragic 91.4% |
| Japanese | 0.0 /100 | #301 | Tragic 91.2% |
| Immigrants | Guyana | 0.0 /100 | #302 | Tragic 91.2% |
| Immigrants | Vietnam | 0.0 /100 | #303 | Tragic 91.2% |
| Pima | 0.0 /100 | #304 | Tragic 91.2% |
| Immigrants | Dominica | 0.0 /100 | #305 | Tragic 91.1% |
Demographics Similar to Paiute by 10th Grade
In terms of 10th grade, the demographic groups most similar to Paiute are Immigrants from South America (92.6%, a difference of 0.010%), Apache (92.6%, a difference of 0.010%), Peruvian (92.6%, a difference of 0.010%), Immigrants from Uzbekistan (92.6%, a difference of 0.040%), and Dutch West Indian (92.6%, a difference of 0.040%).
| Demographics | Rating | Rank | 10th Grade |
| Armenians | 0.9 /100 | #254 | Tragic 92.7% |
| Immigrants | Bolivia | 0.7 /100 | #255 | Tragic 92.7% |
| Immigrants | Nigeria | 0.7 /100 | #256 | Tragic 92.7% |
| U.S. Virgin Islanders | 0.7 /100 | #257 | Tragic 92.7% |
| Immigrants | Costa Rica | 0.6 /100 | #258 | Tragic 92.7% |
| Immigrants | Jamaica | 0.5 /100 | #259 | Tragic 92.6% |
| Immigrants | Uzbekistan | 0.5 /100 | #260 | Tragic 92.6% |
| Paiute | 0.4 /100 | #261 | Tragic 92.6% |
| Immigrants | South America | 0.4 /100 | #262 | Tragic 92.6% |
| Apache | 0.4 /100 | #263 | Tragic 92.6% |
| Peruvians | 0.4 /100 | #264 | Tragic 92.6% |
| Dutch West Indians | 0.4 /100 | #265 | Tragic 92.6% |
| Immigrants | Philippines | 0.4 /100 | #266 | Tragic 92.6% |
| Taiwanese | 0.3 /100 | #267 | Tragic 92.5% |
| Immigrants | Ghana | 0.3 /100 | #268 | Tragic 92.5% |