Cuban vs Immigrants from Eastern Africa Kindergarten
COMPARE
Cuban
Immigrants from Eastern Africa
Kindergarten
Kindergarten Comparison
Cubans
Immigrants from Eastern Africa
97.5%
KINDERGARTEN
0.3/ 100
METRIC RATING
265th/ 347
METRIC RANK
97.6%
KINDERGARTEN
1.0/ 100
METRIC RATING
247th/ 347
METRIC RANK
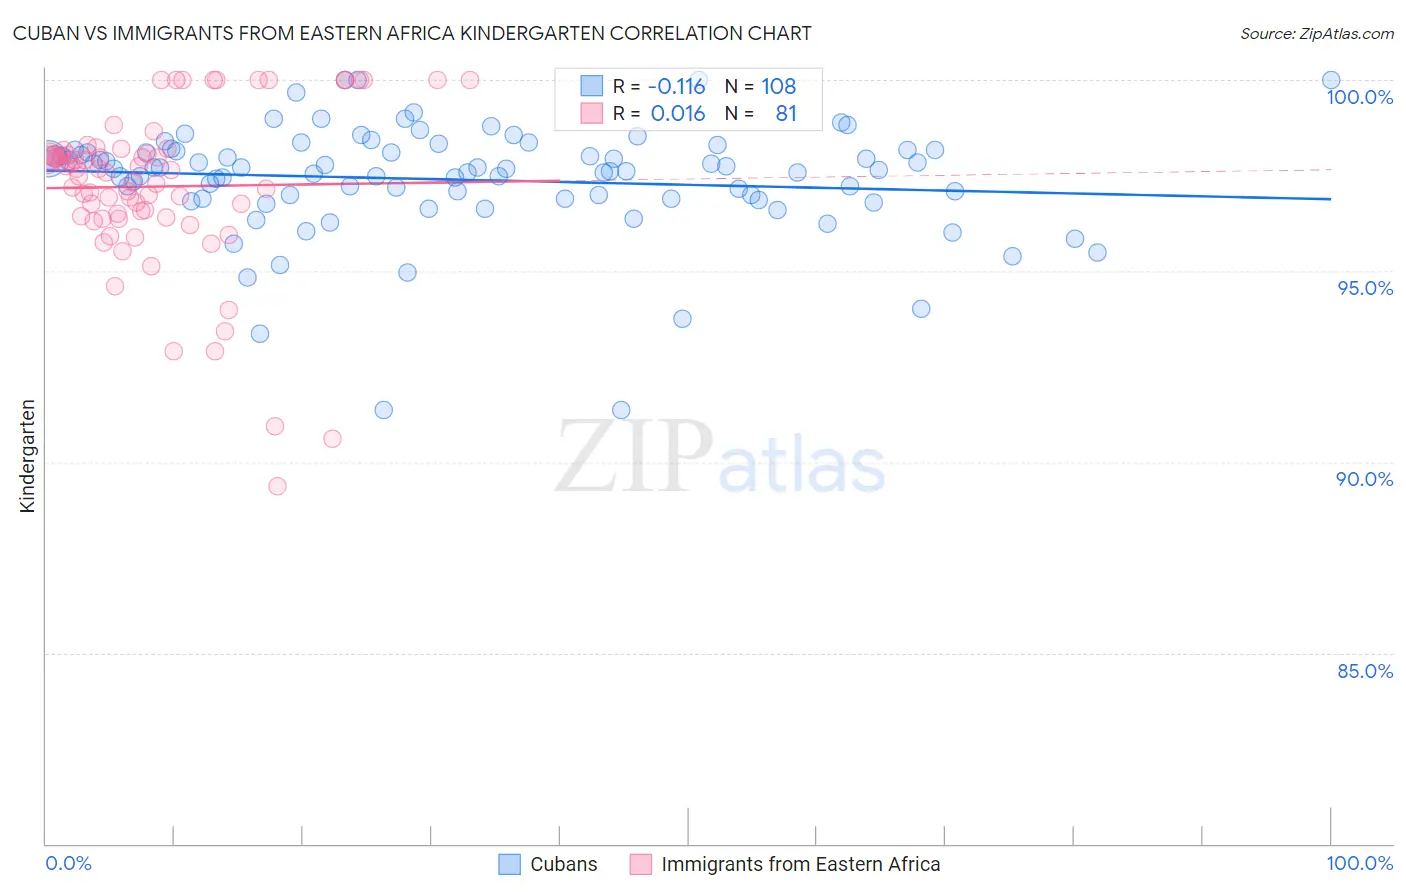
Cuban vs Immigrants from Eastern Africa Kindergarten Correlation Chart
The statistical analysis conducted on geographies consisting of 449,326,865 people shows a poor negative correlation between the proportion of Cubans and percentage of population with at least kindergarten education in the United States with a correlation coefficient (R) of -0.116 and weighted average of 97.5%. Similarly, the statistical analysis conducted on geographies consisting of 355,144,184 people shows no correlation between the proportion of Immigrants from Eastern Africa and percentage of population with at least kindergarten education in the United States with a correlation coefficient (R) of 0.016 and weighted average of 97.6%, a difference of 0.090%.
Kindergarten Correlation Summary
| Measurement | Cuban | Immigrants from Eastern Africa |
| Minimum | 91.4% | 89.4% |
| Maximum | 100.0% | 100.0% |
| Range | 8.6% | 10.6% |
| Mean | 97.4% | 97.2% |
| Median | 97.7% | 97.6% |
| Interquartile 25% (IQ1) | 96.9% | 96.4% |
| Interquartile 75% (IQ3) | 98.1% | 98.1% |
| Interquartile Range (IQR) | 1.3% | 1.7% |
| Standard Deviation (Sample) | 1.5% | 2.1% |
| Standard Deviation (Population) | 1.5% | 2.1% |
Demographics Similar to Cubans and Immigrants from Eastern Africa by Kindergarten
In terms of kindergarten, the demographic groups most similar to Cubans are Immigrants from Sierra Leone (97.5%, a difference of 0.0%), Fijian (97.5%, a difference of 0.020%), Taiwanese (97.5%, a difference of 0.020%), Immigrants from Ethiopia (97.5%, a difference of 0.020%), and Immigrants from South America (97.5%, a difference of 0.020%). Similarly, the demographic groups most similar to Immigrants from Eastern Africa are Indian (Asian) (97.6%, a difference of 0.0%), Immigrants from Middle Africa (97.6%, a difference of 0.0%), Peruvian (97.6%, a difference of 0.0%), Immigrants from Senegal (97.6%, a difference of 0.010%), and Ethiopian (97.6%, a difference of 0.010%).
| Demographics | Rating | Rank | Kindergarten |
| Indians (Asian) | 1.0 /100 | #246 | Tragic 97.6% |
| Immigrants | Eastern Africa | 1.0 /100 | #247 | Tragic 97.6% |
| Immigrants | Middle Africa | 1.0 /100 | #248 | Tragic 97.6% |
| Peruvians | 1.0 /100 | #249 | Tragic 97.6% |
| Immigrants | Senegal | 0.9 /100 | #250 | Tragic 97.6% |
| Ethiopians | 0.9 /100 | #251 | Tragic 97.6% |
| Immigrants | Iraq | 0.9 /100 | #252 | Tragic 97.6% |
| Immigrants | Africa | 0.8 /100 | #253 | Tragic 97.6% |
| Immigrants | Asia | 0.8 /100 | #254 | Tragic 97.6% |
| Immigrants | Congo | 0.8 /100 | #255 | Tragic 97.6% |
| Yaqui | 0.7 /100 | #256 | Tragic 97.6% |
| Immigrants | Colombia | 0.6 /100 | #257 | Tragic 97.6% |
| Jamaicans | 0.6 /100 | #258 | Tragic 97.6% |
| Armenians | 0.5 /100 | #259 | Tragic 97.6% |
| Fijians | 0.5 /100 | #260 | Tragic 97.5% |
| Taiwanese | 0.4 /100 | #261 | Tragic 97.5% |
| Immigrants | Ethiopia | 0.4 /100 | #262 | Tragic 97.5% |
| Immigrants | South America | 0.4 /100 | #263 | Tragic 97.5% |
| Assyrians/Chaldeans/Syriacs | 0.4 /100 | #264 | Tragic 97.5% |
| Cubans | 0.3 /100 | #265 | Tragic 97.5% |
| Immigrants | Sierra Leone | 0.3 /100 | #266 | Tragic 97.5% |