Crow vs Osage 6th Grade
COMPARE
Crow
Osage
6th Grade
6th Grade Comparison
Crow
Osage
99.4%
6TH GRADE
100.0/ 100
METRIC RATING
1st/ 347
METRIC RANK
97.6%
6TH GRADE
99.3/ 100
METRIC RATING
80th/ 347
METRIC RANK
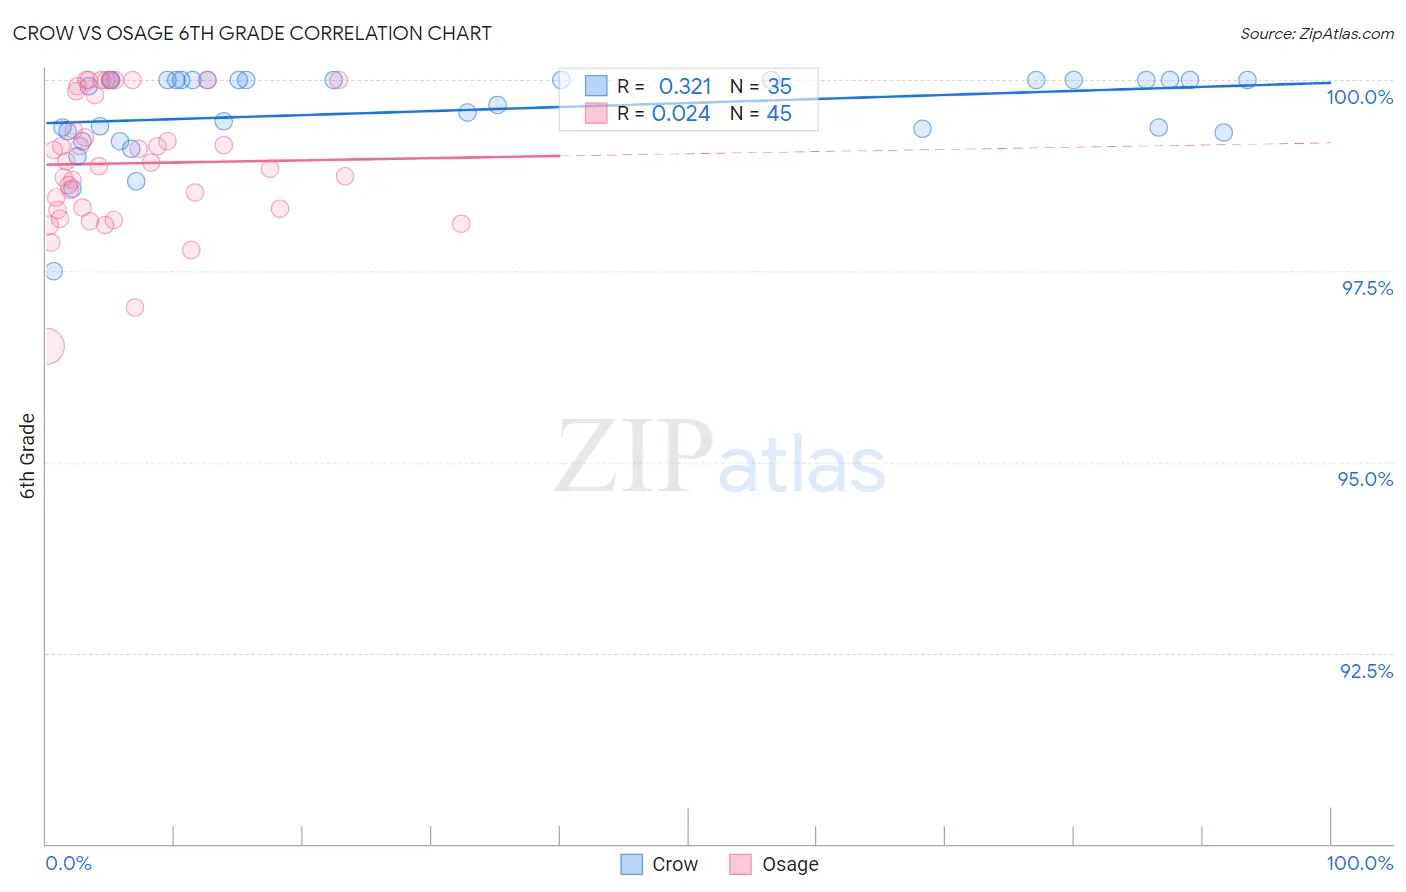
Crow vs Osage 6th Grade Correlation Chart
The statistical analysis conducted on geographies consisting of 665,246 people shows a mild positive correlation between the proportion of Crow and percentage of population with at least 6th grade education in the United States with a correlation coefficient (R) of 0.321 and weighted average of 99.4%. Similarly, the statistical analysis conducted on geographies consisting of 91,808,929 people shows no correlation between the proportion of Osage and percentage of population with at least 6th grade education in the United States with a correlation coefficient (R) of 0.024 and weighted average of 97.6%, a difference of 1.8%.
6th Grade Correlation Summary
| Measurement | Crow | Osage |
| Minimum | 97.5% | 96.5% |
| Maximum | 100.0% | 100.0% |
| Range | 2.5% | 3.5% |
| Mean | 99.6% | 98.9% |
| Median | 100.0% | 98.9% |
| Interquartile 25% (IQ1) | 99.3% | 98.3% |
| Interquartile 75% (IQ3) | 100.0% | 99.8% |
| Interquartile Range (IQR) | 0.68% | 1.5% |
| Standard Deviation (Sample) | 0.56% | 0.84% |
| Standard Deviation (Population) | 0.55% | 0.83% |
Similar Demographics by 6th Grade
Demographics Similar to Crow by 6th Grade
In terms of 6th grade, the demographic groups most similar to Crow are Ottawa (98.5%, a difference of 0.88%), Welsh (98.5%, a difference of 0.89%), Dutch (98.4%, a difference of 1.0%), Tsimshian (98.3%, a difference of 1.1%), and Norwegian (98.3%, a difference of 1.1%).
| Demographics | Rating | Rank | 6th Grade |
| Crow | 100.0 /100 | #1 | Exceptional 99.4% |
| Ottawa | 100.0 /100 | #2 | Exceptional 98.5% |
| Welsh | 100.0 /100 | #3 | Exceptional 98.5% |
| Dutch | 100.0 /100 | #4 | Exceptional 98.4% |
| Tsimshian | 100.0 /100 | #5 | Exceptional 98.3% |
| Norwegians | 100.0 /100 | #6 | Exceptional 98.3% |
| Germans | 100.0 /100 | #7 | Exceptional 98.2% |
| Slovaks | 100.0 /100 | #8 | Exceptional 98.2% |
| Slovenes | 100.0 /100 | #9 | Exceptional 98.2% |
| Swedes | 100.0 /100 | #10 | Exceptional 98.2% |
| English | 100.0 /100 | #11 | Exceptional 98.1% |
| Alaskan Athabascans | 100.0 /100 | #12 | Exceptional 98.1% |
| Tlingit-Haida | 100.0 /100 | #13 | Exceptional 98.1% |
| Carpatho Rusyns | 100.0 /100 | #14 | Exceptional 98.1% |
| Inupiat | 100.0 /100 | #15 | Exceptional 98.1% |
Demographics Similar to Osage by 6th Grade
In terms of 6th grade, the demographic groups most similar to Osage are Immigrants from India (97.6%, a difference of 0.0%), Immigrants from Lithuania (97.6%, a difference of 0.010%), Icelander (97.6%, a difference of 0.010%), Lumbee (97.6%, a difference of 0.010%), and Immigrants from Netherlands (97.6%, a difference of 0.020%).
| Demographics | Rating | Rank | 6th Grade |
| Cherokee | 99.4 /100 | #73 | Exceptional 97.6% |
| Immigrants | Netherlands | 99.4 /100 | #74 | Exceptional 97.6% |
| Ukrainians | 99.4 /100 | #75 | Exceptional 97.6% |
| Immigrants | England | 99.4 /100 | #76 | Exceptional 97.6% |
| Immigrants | Lithuania | 99.3 /100 | #77 | Exceptional 97.6% |
| Icelanders | 99.3 /100 | #78 | Exceptional 97.6% |
| Immigrants | India | 99.3 /100 | #79 | Exceptional 97.6% |
| Osage | 99.3 /100 | #80 | Exceptional 97.6% |
| Lumbee | 99.2 /100 | #81 | Exceptional 97.6% |
| Zimbabweans | 99.1 /100 | #82 | Exceptional 97.6% |
| Potawatomi | 99.1 /100 | #83 | Exceptional 97.6% |
| Shoshone | 99.0 /100 | #84 | Exceptional 97.6% |
| Delaware | 98.9 /100 | #85 | Exceptional 97.6% |
| Immigrants | Belgium | 98.9 /100 | #86 | Exceptional 97.5% |
| Puget Sound Salish | 98.9 /100 | #87 | Exceptional 97.5% |