Croatian vs Immigrants from Netherlands 5th Grade
COMPARE
Croatian
Immigrants from Netherlands
5th Grade
5th Grade Comparison
Croatians
Immigrants from Netherlands
98.2%
5TH GRADE
100.0/ 100
METRIC RATING
22nd/ 347
METRIC RANK
97.8%
5TH GRADE
99.3/ 100
METRIC RATING
76th/ 347
METRIC RANK
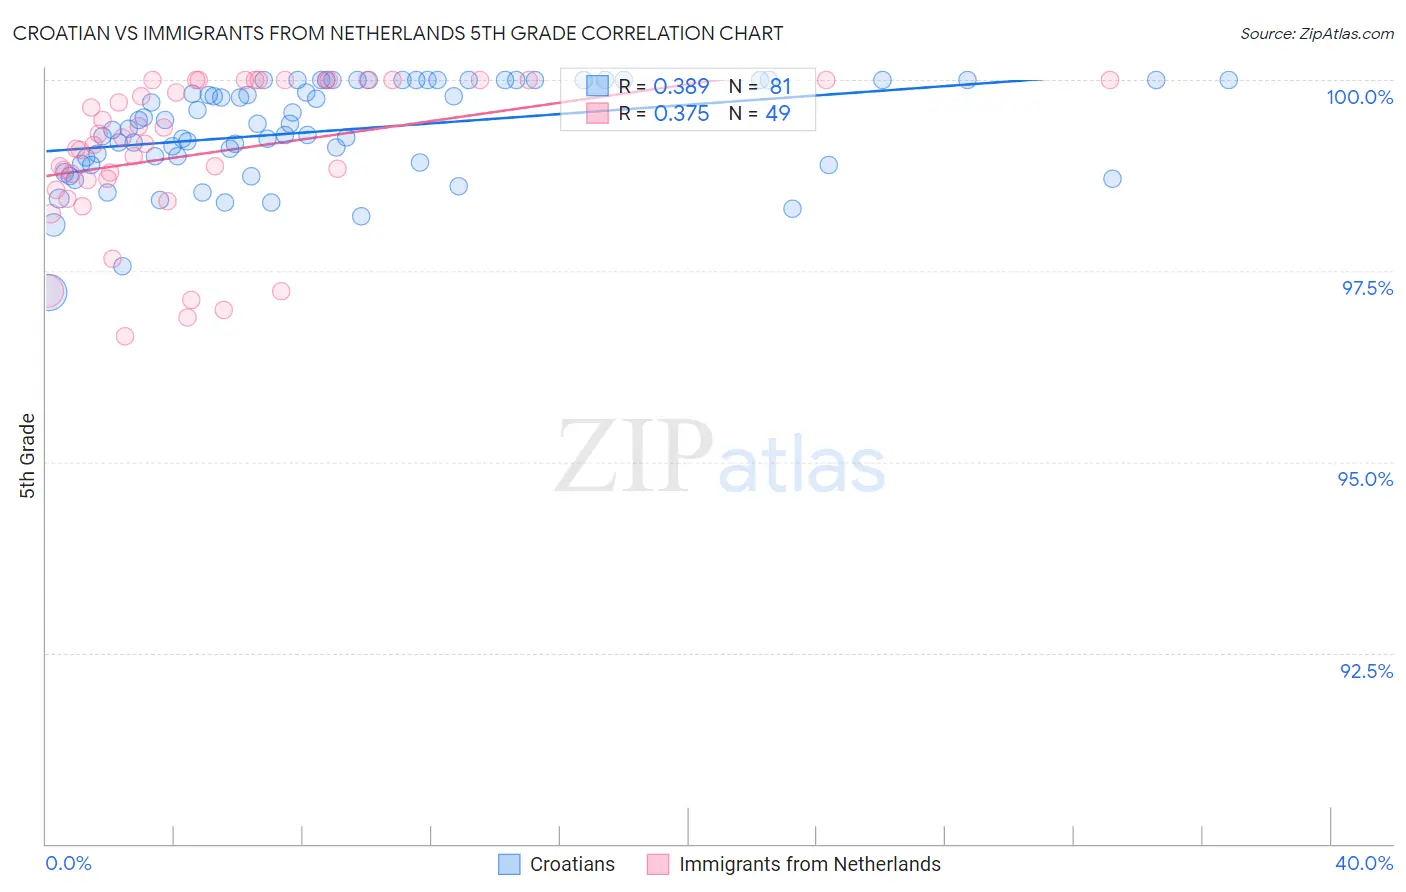
Croatian vs Immigrants from Netherlands 5th Grade Correlation Chart
The statistical analysis conducted on geographies consisting of 375,731,938 people shows a mild positive correlation between the proportion of Croatians and percentage of population with at least 5th grade education in the United States with a correlation coefficient (R) of 0.389 and weighted average of 98.2%. Similarly, the statistical analysis conducted on geographies consisting of 237,869,709 people shows a mild positive correlation between the proportion of Immigrants from Netherlands and percentage of population with at least 5th grade education in the United States with a correlation coefficient (R) of 0.375 and weighted average of 97.8%, a difference of 0.38%.
5th Grade Correlation Summary
| Measurement | Croatian | Immigrants from Netherlands |
| Minimum | 97.2% | 96.6% |
| Maximum | 100.0% | 100.0% |
| Range | 2.8% | 3.4% |
| Mean | 99.3% | 99.0% |
| Median | 99.4% | 99.2% |
| Interquartile 25% (IQ1) | 98.9% | 98.6% |
| Interquartile 75% (IQ3) | 100.0% | 100.0% |
| Interquartile Range (IQR) | 1.1% | 1.4% |
| Standard Deviation (Sample) | 0.64% | 0.98% |
| Standard Deviation (Population) | 0.64% | 0.97% |
Similar Demographics by 5th Grade
Demographics Similar to Croatians by 5th Grade
In terms of 5th grade, the demographic groups most similar to Croatians are Sioux (98.2%, a difference of 0.0%), Scotch-Irish (98.2%, a difference of 0.0%), Danish (98.2%, a difference of 0.010%), Yup'ik (98.2%, a difference of 0.010%), and Alaska Native (98.2%, a difference of 0.010%).
| Demographics | Rating | Rank | 5th Grade |
| Scottish | 100.0 /100 | #15 | Exceptional 98.3% |
| Poles | 100.0 /100 | #16 | Exceptional 98.3% |
| Irish | 100.0 /100 | #17 | Exceptional 98.3% |
| Pennsylvania Germans | 100.0 /100 | #18 | Exceptional 98.3% |
| Finns | 100.0 /100 | #19 | Exceptional 98.2% |
| Lithuanians | 100.0 /100 | #20 | Exceptional 98.2% |
| Danes | 100.0 /100 | #21 | Exceptional 98.2% |
| Croatians | 100.0 /100 | #22 | Exceptional 98.2% |
| Sioux | 100.0 /100 | #23 | Exceptional 98.2% |
| Scotch-Irish | 100.0 /100 | #24 | Exceptional 98.2% |
| Yup'ik | 100.0 /100 | #25 | Exceptional 98.2% |
| Alaska Natives | 100.0 /100 | #26 | Exceptional 98.2% |
| French | 100.0 /100 | #27 | Exceptional 98.2% |
| Czechs | 100.0 /100 | #28 | Exceptional 98.2% |
| Scandinavians | 100.0 /100 | #29 | Exceptional 98.2% |
Demographics Similar to Immigrants from Netherlands by 5th Grade
In terms of 5th grade, the demographic groups most similar to Immigrants from Netherlands are Lumbee (97.8%, a difference of 0.0%), Ukrainian (97.8%, a difference of 0.0%), Immigrants from England (97.8%, a difference of 0.0%), Cherokee (97.8%, a difference of 0.010%), and Osage (97.8%, a difference of 0.010%).
| Demographics | Rating | Rank | 5th Grade |
| Kiowa | 99.5 /100 | #69 | Exceptional 97.9% |
| Iranians | 99.5 /100 | #70 | Exceptional 97.9% |
| Chickasaw | 99.5 /100 | #71 | Exceptional 97.9% |
| Macedonians | 99.4 /100 | #72 | Exceptional 97.9% |
| Cherokee | 99.4 /100 | #73 | Exceptional 97.8% |
| Lumbee | 99.3 /100 | #74 | Exceptional 97.8% |
| Ukrainians | 99.3 /100 | #75 | Exceptional 97.8% |
| Immigrants | Netherlands | 99.3 /100 | #76 | Exceptional 97.8% |
| Immigrants | England | 99.3 /100 | #77 | Exceptional 97.8% |
| Osage | 99.3 /100 | #78 | Exceptional 97.8% |
| Immigrants | Lithuania | 99.2 /100 | #79 | Exceptional 97.8% |
| Immigrants | India | 99.2 /100 | #80 | Exceptional 97.8% |
| Icelanders | 99.2 /100 | #81 | Exceptional 97.8% |
| Pueblo | 99.2 /100 | #82 | Exceptional 97.8% |
| Zimbabweans | 99.0 /100 | #83 | Exceptional 97.8% |