Croatian vs Immigrants from Europe 12th Grade, No Diploma

COMPARE

Croatian
Race
Ancestry
AfghanAfricanAlaska NativeAlaskan AthabascanAlbanianAleutAlsatianAmericanApacheArabArapahoArgentineanArmenianAssyrian/Chaldean/SyriacAustralianAustrianBahamianBangladeshiBarbadianBasqueBelgianBelizeanBermudanBhutaneseBlackfeetBolivianBrazilianBritishBritish West IndianBulgarianBurmeseCajunCambodianCanadianCape VerdeanCarpatho RusynCelticCentral AmericanCentral American IndianCherokeeCheyenneChickasawChileanChineseChippewaChoctawColombianColvilleComancheCosta RicanCreeCreekCroatianCrowCubanCypriotCzechCzechoslovakianDanishDelawareDominicanDutchDutch West IndianEastern EuropeanEcuadorianEgyptianEnglishEstonianEthiopianEuropeanFijianFilipinoFinnishFrenchFrench American IndianFrench CanadianGermanGerman RussianGhanaianGreekGuamanian/ChamorroGuatemalanGuyaneseHaitianHmongHonduranHopiHoumaHungarianIcelanderIndian (Asian)IndonesianInupiatIranianIraqiIrishIroquoisIsraeliItalianJamaicanJapaneseJordanianKenyanKiowaKoreanLaotianLatvianLebaneseLiberianLithuanianLumbeeLuxembourgerMacedonianMalaysianMalteseMarshalleseMenomineeMexicanMexican American IndianMongolianMoroccanNative HawaiianNavajoNepaleseNew ZealanderNicaraguanNigerianNorthern EuropeanNorwegianOkinawanOsageOttawaPaiutePakistaniPalestinianPanamanianParaguayanPennsylvania GermanPeruvianPimaPolishPortuguesePotawatomiPuebloPuerto RicanPuget Sound SalishRomanianRussianSalvadoranSamoanScandinavianScotch-IrishScottishSeminoleSenegaleseSerbianShoshoneSierra LeoneanSiouxSlavicSlovakSloveneSomaliSouth AfricanSouth AmericanSouth American IndianSoviet UnionSpaniardSpanishSpanish AmericanSpanish American IndianSri LankanSubsaharan AfricanSudaneseSwedishSwissSyrianTaiwaneseThaiTlingit-HaidaTohono O'OdhamTonganTrinidadian and TobagonianTsimshianTurkishU.S. Virgin IslanderUgandanUkrainianUruguayanUteVenezuelanVietnameseWelshWest IndianYakamaYaquiYugoslavianYumanYup'ikZimbabwean
Immigration
NonimmigrantsImmigrantsAfghanistanAfricaAlbaniaArgentinaArmeniaAsiaAustraliaAustriaBahamasBangladeshBarbadosBelarusBelgiumBelizeBoliviaBosnia and HerzegovinaBrazilBulgariaBurma/MyanmarCabo VerdeCambodiaCameroonCanadaCaribbeanCentral AmericaChileChinaColombiaCongoCosta RicaCroatiaCubaCzechoslovakiaDenmarkDominicaDominican RepublicEastern AfricaEastern AsiaEastern EuropeEcuadorEgyptEl SalvadorEnglandEritreaEthiopiaFijiFranceGermanyGhanaGreeceGrenadaGuatemalaGuyanaHaitiHondurasHong KongHungaryIndiaIndonesiaIranIraqIrelandIsraelItalyJamaicaJapanJordanKazakhstanKenyaKoreaKuwaitLaosLatin AmericaLatviaLebanonLiberiaLithuaniaMalaysiaMexicoMicronesiaMiddle AfricaMoldovaMoroccoNepalNetherlandsNicaraguaNigeriaNorth AmericaNorth MacedoniaNorthern AfricaNorthern EuropeNorwayOceaniaPakistanPanamaPeruPhilippinesPolandPortugalRomaniaRussiaSaudi ArabiaScotlandSenegalSerbiaSierra LeoneSingaporeSomaliaSouth AfricaSouth AmericaSouth Central AsiaSouth Eastern AsiaSouthern EuropeSpainSri LankaSt. Vincent and the GrenadinesSudanSwedenSwitzerlandSyriaTaiwanThailandTrinidad and TobagoTurkeyUgandaUkraineUruguayUzbekistanVenezuelaVietnamWest IndiesWestern AfricaWestern AsiaWestern EuropeYemenZaireZimbabweAzores
Immigrants from Europe
Race
Ancestry
AfghanAfricanAlaska NativeAlaskan AthabascanAlbanianAleutAlsatianAmericanApacheArabArapahoArgentineanArmenianAssyrian/Chaldean/SyriacAustralianAustrianBahamianBangladeshiBarbadianBasqueBelgianBelizeanBermudanBhutaneseBlackfeetBolivianBrazilianBritishBritish West IndianBulgarianBurmeseCajunCambodianCanadianCape VerdeanCarpatho RusynCelticCentral AmericanCentral American IndianCherokeeCheyenneChickasawChileanChineseChippewaChoctawColombianColvilleComancheCosta RicanCreeCreekCrowCubanCypriotCzechCzechoslovakianDanishDelawareDominicanDutchDutch West IndianEastern EuropeanEcuadorianEgyptianEnglishEstonianEthiopianEuropeanFijianFilipinoFinnishFrenchFrench American IndianFrench CanadianGermanGerman RussianGhanaianGreekGuamanian/ChamorroGuatemalanGuyaneseHaitianHmongHonduranHopiHoumaHungarianIcelanderIndian (Asian)IndonesianInupiatIranianIraqiIrishIroquoisIsraeliItalianJamaicanJapaneseJordanianKenyanKiowaKoreanLaotianLatvianLebaneseLiberianLithuanianLumbeeLuxembourgerMacedonianMalaysianMalteseMarshalleseMenomineeMexicanMexican American IndianMongolianMoroccanNative HawaiianNavajoNepaleseNew ZealanderNicaraguanNigerianNorthern EuropeanNorwegianOkinawanOsageOttawaPaiutePakistaniPalestinianPanamanianParaguayanPennsylvania GermanPeruvianPimaPolishPortuguesePotawatomiPuebloPuerto RicanPuget Sound SalishRomanianRussianSalvadoranSamoanScandinavianScotch-IrishScottishSeminoleSenegaleseSerbianShoshoneSierra LeoneanSiouxSlavicSlovakSloveneSomaliSouth AfricanSouth AmericanSouth American IndianSoviet UnionSpaniardSpanishSpanish AmericanSpanish American IndianSri LankanSubsaharan AfricanSudaneseSwedishSwissSyrianTaiwaneseThaiTlingit-HaidaTohono O'OdhamTonganTrinidadian and TobagonianTsimshianTurkishU.S. Virgin IslanderUgandanUkrainianUruguayanUteVenezuelanVietnameseWelshWest IndianYakamaYaquiYugoslavianYumanYup'ikZimbabwean
Immigration
NonimmigrantsImmigrantsAfghanistanAfricaAlbaniaArgentinaArmeniaAsiaAustraliaAustriaBahamasBangladeshBarbadosBelarusBelgiumBelizeBoliviaBosnia and HerzegovinaBrazilBulgariaBurma/MyanmarCabo VerdeCambodiaCameroonCanadaCaribbeanCentral AmericaChileChinaColombiaCongoCosta RicaCroatiaCubaCzechoslovakiaDenmarkDominicaDominican RepublicEastern AfricaEastern AsiaEastern EuropeEcuadorEgyptEl SalvadorEnglandEritreaEthiopiaEuropeFijiFranceGermanyGhanaGreeceGrenadaGuatemalaGuyanaHaitiHondurasHong KongHungaryIndiaIndonesiaIranIraqIrelandIsraelItalyJamaicaJapanJordanKazakhstanKenyaKoreaKuwaitLaosLatin AmericaLatviaLebanonLiberiaLithuaniaMalaysiaMexicoMicronesiaMiddle AfricaMoldovaMoroccoNepalNetherlandsNicaraguaNigeriaNorth AmericaNorth MacedoniaNorthern AfricaNorthern EuropeNorwayOceaniaPakistanPanamaPeruPhilippinesPolandPortugalRomaniaRussiaSaudi ArabiaScotlandSenegalSerbiaSierra LeoneSingaporeSomaliaSouth AfricaSouth AmericaSouth Central AsiaSouth Eastern AsiaSouthern EuropeSpainSri LankaSt. Vincent and the GrenadinesSudanSwedenSwitzerlandSyriaTaiwanThailandTrinidad and TobagoTurkeyUgandaUkraineUruguayUzbekistanVenezuelaVietnamWest IndiesWestern AfricaWestern AsiaWestern EuropeYemenZaireZimbabweAzores
12th Grade, No Diploma
Income
Poverty
Unemployment
Labor Participation
Family Structure
Vehicle Availability
Education Level
Disability

12th Grade, No Diploma Comparison

Croatians

Immigrants from Europe

Exceptional
Exceptional
93.5%
12TH GRADE, NO DIPLOMA
100.0/ 100
METRIC RATING
10th/ 347
METRIC RANK
92.3%
12TH GRADE, NO DIPLOMA
98.5/ 100
METRIC RATING
94th/ 347
METRIC RANK

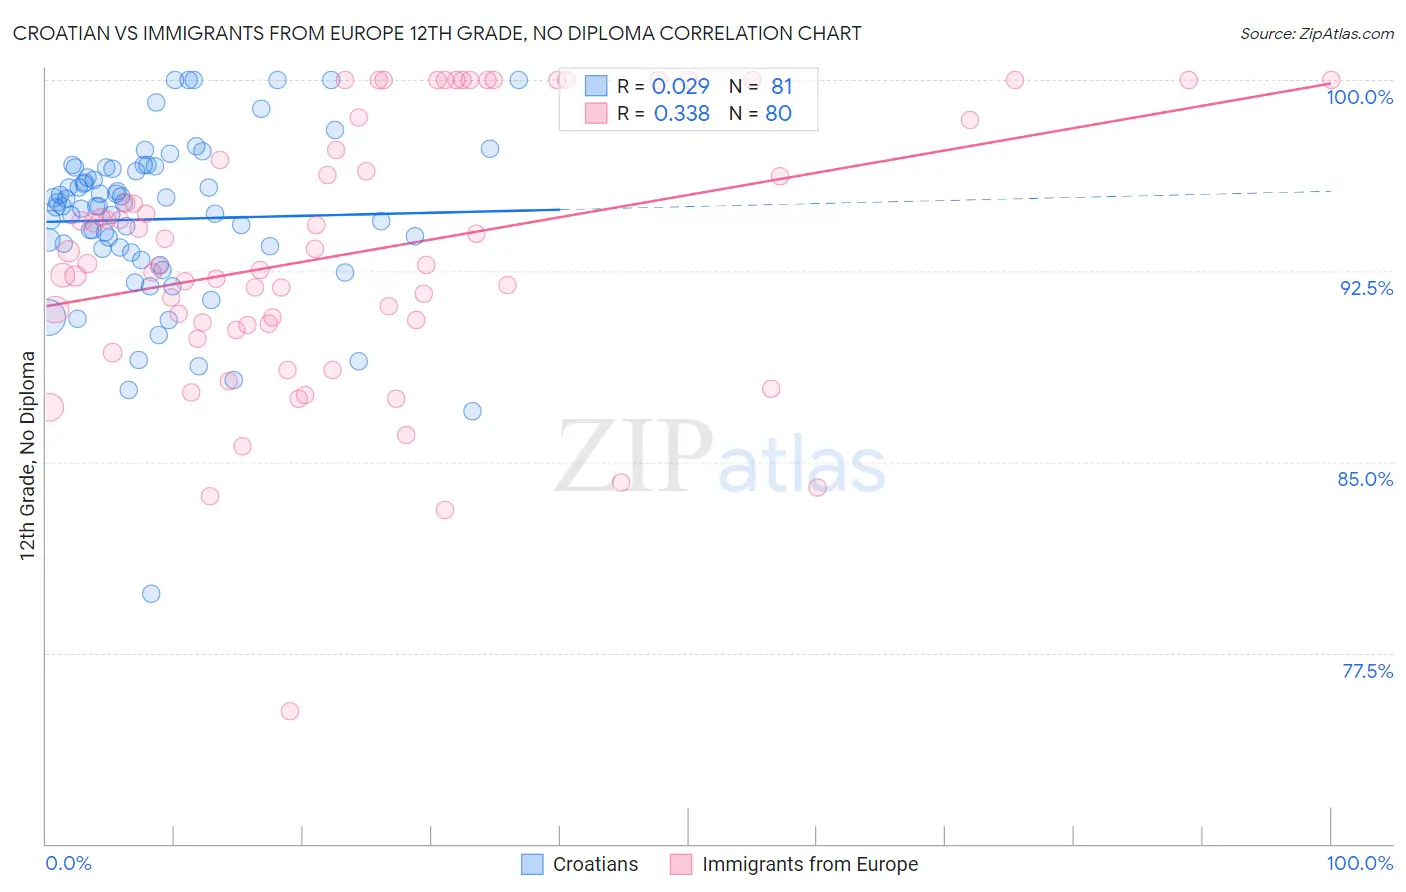
Croatian vs Immigrants from Europe 12th Grade, No Diploma Correlation Chart

The statistical analysis conducted on geographies consisting of 375,733,787 people shows no correlation between the proportion of Croatians and percentage of population with at least 12th grade (no diploma) education in the United States with a correlation coefficient (R) of 0.029 and weighted average of 93.5%. Similarly, the statistical analysis conducted on geographies consisting of 547,425,973 people shows a mild positive correlation between the proportion of Immigrants from Europe and percentage of population with at least 12th grade (no diploma) education in the United States with a correlation coefficient (R) of 0.338 and weighted average of 92.3%, a difference of 1.3%.
Croatian vs Immigrants from Europe 12th Grade, No Diploma

12th Grade, No Diploma Correlation Summary

MeasurementCroatianImmigrants from Europe
Minimum79.8%75.2%
Maximum100.0%100.0%
Range20.2%24.8%
Mean94.5%93.2%
Median95.0%92.8%
Interquartile 25% (IQ1)93.3%90.4%
Interquartile 75% (IQ3)96.5%97.9%
Interquartile Range (IQR)3.2%7.4%
Standard Deviation (Sample)3.3%5.2%
Standard Deviation (Population)3.3%5.2%

Similar Demographics by 12th Grade, No Diploma

Demographics Similar to Croatians by 12th Grade, No Diploma

In terms of 12th grade, no diploma, the demographic groups most similar to Croatians are Latvian (93.6%, a difference of 0.020%), Slovak (93.6%, a difference of 0.030%), Chinese (93.6%, a difference of 0.030%), Polish (93.5%, a difference of 0.060%), and Eastern European (93.5%, a difference of 0.060%).
DemographicsRating | Rank12th Grade, No Diploma
Lithuanians
100.0
/100
|
#3
Exceptional
93.6%
Slovenes
100.0
/100
|
#4
Exceptional
93.6%
Carpatho Rusyns
100.0
/100
|
#5
Exceptional
93.6%
Immigrants | India
100.0
/100
|
#6
Exceptional
93.6%
Slovaks
100.0
/100
|
#7
Exceptional
93.6%
Chinese
100.0
/100
|
#8
Exceptional
93.6%
Latvians
100.0
/100
|
#9
Exceptional
93.6%
Croatians
100.0
/100
|
#10
Exceptional
93.5%
Poles
100.0
/100
|
#11
Exceptional
93.5%
Eastern Europeans
100.0
/100
|
#12
Exceptional
93.5%
Danes
100.0
/100
|
#13
Exceptional
93.5%
Bulgarians
100.0
/100
|
#14
Exceptional
93.5%
Finns
100.0
/100
|
#15
Exceptional
93.4%
Maltese
100.0
/100
|
#16
Exceptional
93.3%
Luxembourgers
100.0
/100
|
#17
Exceptional
93.3%

Demographics Similar to Immigrants from Europe by 12th Grade, No Diploma

In terms of 12th grade, no diploma, the demographic groups most similar to Immigrants from Europe are Immigrants from North Macedonia (92.3%, a difference of 0.0%), Icelander (92.3%, a difference of 0.0%), Immigrants from Romania (92.3%, a difference of 0.010%), Immigrants from Western Europe (92.3%, a difference of 0.010%), and Celtic (92.3%, a difference of 0.010%).
DemographicsRating | Rank12th Grade, No Diploma
Immigrants | France
98.8
/100
|
#87
Exceptional
92.4%
Scotch-Irish
98.8
/100
|
#88
Exceptional
92.4%
Canadians
98.7
/100
|
#89
Exceptional
92.4%
Immigrants | Serbia
98.6
/100
|
#90
Exceptional
92.4%
South Africans
98.6
/100
|
#91
Exceptional
92.4%
Immigrants | Romania
98.5
/100
|
#92
Exceptional
92.3%
Immigrants | Western Europe
98.5
/100
|
#93
Exceptional
92.3%
Immigrants | Europe
98.5
/100
|
#94
Exceptional
92.3%
Immigrants | North Macedonia
98.5
/100
|
#95
Exceptional
92.3%
Icelanders
98.5
/100
|
#96
Exceptional
92.3%
Celtics
98.4
/100
|
#97
Exceptional
92.3%
Immigrants | Kuwait
98.4
/100
|
#98
Exceptional
92.3%
Immigrants | Korea
98.3
/100
|
#99
Exceptional
92.3%
Immigrants | Croatia
98.3
/100
|
#100
Exceptional
92.3%
Swiss
98.1
/100
|
#101
Exceptional
92.3%