Creek vs Immigrants from Belgium 6th Grade
COMPARE
Creek
Immigrants from Belgium
6th Grade
6th Grade Comparison
Creek
Immigrants from Belgium
97.7%
6TH GRADE
99.8/ 100
METRIC RATING
54th/ 347
METRIC RANK
97.5%
6TH GRADE
98.9/ 100
METRIC RATING
86th/ 347
METRIC RANK
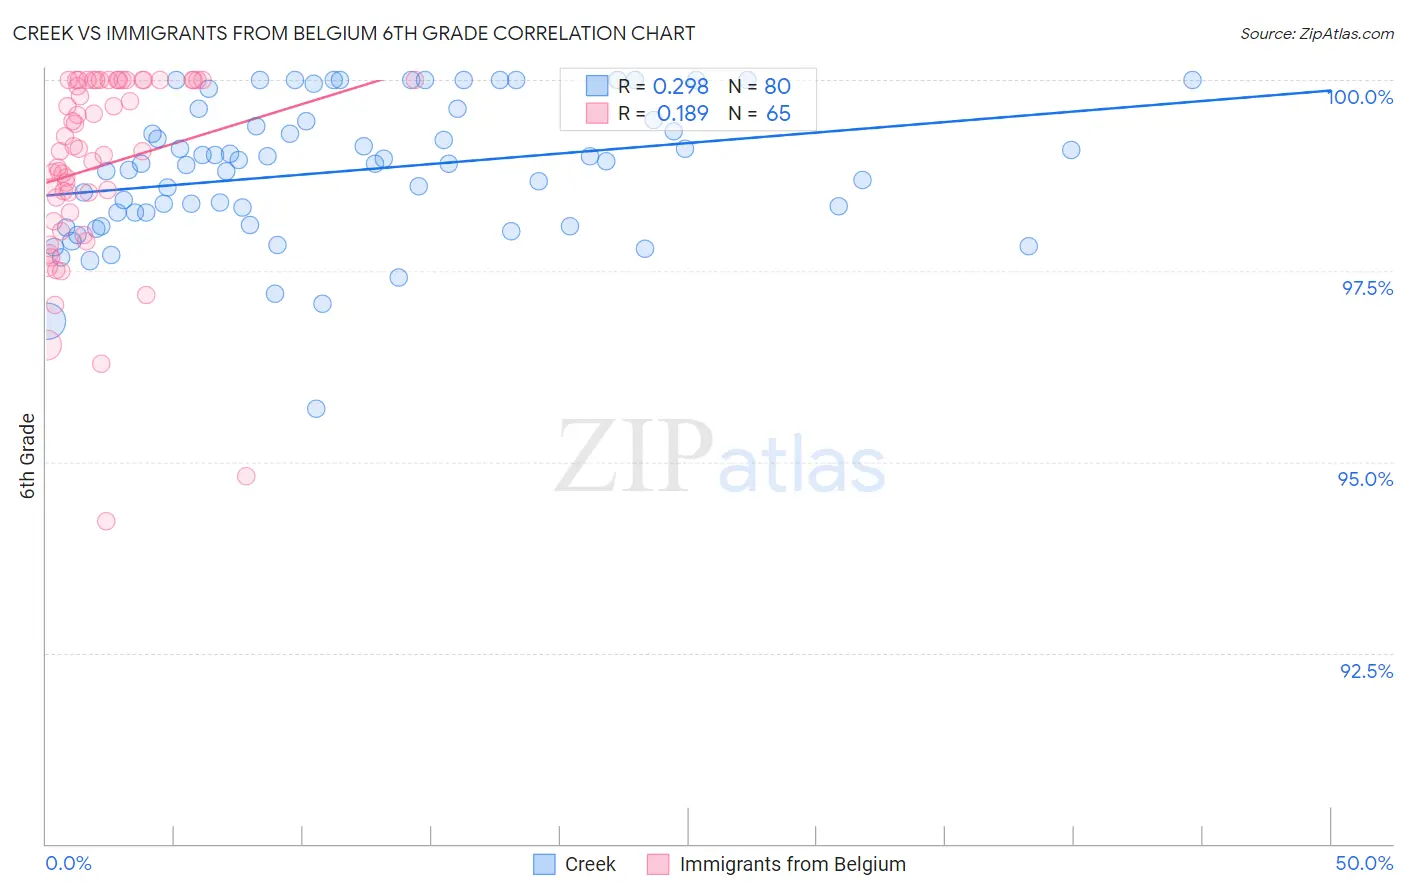
Creek vs Immigrants from Belgium 6th Grade Correlation Chart
The statistical analysis conducted on geographies consisting of 178,480,663 people shows a weak positive correlation between the proportion of Creek and percentage of population with at least 6th grade education in the United States with a correlation coefficient (R) of 0.298 and weighted average of 97.7%. Similarly, the statistical analysis conducted on geographies consisting of 146,727,969 people shows a poor positive correlation between the proportion of Immigrants from Belgium and percentage of population with at least 6th grade education in the United States with a correlation coefficient (R) of 0.189 and weighted average of 97.5%, a difference of 0.21%.
6th Grade Correlation Summary
| Measurement | Creek | Immigrants from Belgium |
| Minimum | 95.7% | 94.2% |
| Maximum | 100.0% | 100.0% |
| Range | 4.3% | 5.8% |
| Mean | 98.8% | 98.9% |
| Median | 98.9% | 99.1% |
| Interquartile 25% (IQ1) | 98.2% | 98.2% |
| Interquartile 75% (IQ3) | 99.5% | 100.0% |
| Interquartile Range (IQR) | 1.3% | 1.8% |
| Standard Deviation (Sample) | 0.90% | 1.3% |
| Standard Deviation (Population) | 0.90% | 1.2% |
Similar Demographics by 6th Grade
Demographics Similar to Creek by 6th Grade
In terms of 6th grade, the demographic groups most similar to Creek are Aleut (97.7%, a difference of 0.0%), Maltese (97.8%, a difference of 0.010%), Australian (97.8%, a difference of 0.010%), Slavic (97.8%, a difference of 0.010%), and Austrian (97.7%, a difference of 0.010%).
| Demographics | Rating | Rank | 6th Grade |
| Native Hawaiians | 99.9 /100 | #47 | Exceptional 97.8% |
| Celtics | 99.9 /100 | #48 | Exceptional 97.8% |
| Estonians | 99.8 /100 | #49 | Exceptional 97.8% |
| Immigrants | Scotland | 99.8 /100 | #50 | Exceptional 97.8% |
| Maltese | 99.8 /100 | #51 | Exceptional 97.8% |
| Australians | 99.8 /100 | #52 | Exceptional 97.8% |
| Slavs | 99.8 /100 | #53 | Exceptional 97.8% |
| Creek | 99.8 /100 | #54 | Exceptional 97.7% |
| Aleuts | 99.8 /100 | #55 | Exceptional 97.7% |
| Austrians | 99.8 /100 | #56 | Exceptional 97.7% |
| Whites/Caucasians | 99.8 /100 | #57 | Exceptional 97.7% |
| Greeks | 99.8 /100 | #58 | Exceptional 97.7% |
| Americans | 99.8 /100 | #59 | Exceptional 97.7% |
| Immigrants | Canada | 99.8 /100 | #60 | Exceptional 97.7% |
| Serbians | 99.7 /100 | #61 | Exceptional 97.7% |
Demographics Similar to Immigrants from Belgium by 6th Grade
In terms of 6th grade, the demographic groups most similar to Immigrants from Belgium are Puget Sound Salish (97.5%, a difference of 0.0%), Immigrants from South Africa (97.5%, a difference of 0.0%), Delaware (97.6%, a difference of 0.010%), Immigrants from Australia (97.5%, a difference of 0.010%), and Pueblo (97.5%, a difference of 0.010%).
| Demographics | Rating | Rank | 6th Grade |
| Immigrants | India | 99.3 /100 | #79 | Exceptional 97.6% |
| Osage | 99.3 /100 | #80 | Exceptional 97.6% |
| Lumbee | 99.2 /100 | #81 | Exceptional 97.6% |
| Zimbabweans | 99.1 /100 | #82 | Exceptional 97.6% |
| Potawatomi | 99.1 /100 | #83 | Exceptional 97.6% |
| Shoshone | 99.0 /100 | #84 | Exceptional 97.6% |
| Delaware | 98.9 /100 | #85 | Exceptional 97.6% |
| Immigrants | Belgium | 98.9 /100 | #86 | Exceptional 97.5% |
| Puget Sound Salish | 98.9 /100 | #87 | Exceptional 97.5% |
| Immigrants | South Africa | 98.9 /100 | #88 | Exceptional 97.5% |
| Immigrants | Australia | 98.8 /100 | #89 | Exceptional 97.5% |
| Pueblo | 98.8 /100 | #90 | Exceptional 97.5% |
| Immigrants | Western Europe | 98.8 /100 | #91 | Exceptional 97.5% |
| Romanians | 98.7 /100 | #92 | Exceptional 97.5% |
| Cree | 98.7 /100 | #93 | Exceptional 97.5% |