Costa Rican vs Liberian 4th Grade
COMPARE
Costa Rican
Liberian
4th Grade
4th Grade Comparison
Costa Ricans
Liberians
97.3%
4TH GRADE
8.3/ 100
METRIC RATING
213th/ 347
METRIC RANK
97.2%
4TH GRADE
3.6/ 100
METRIC RATING
229th/ 347
METRIC RANK
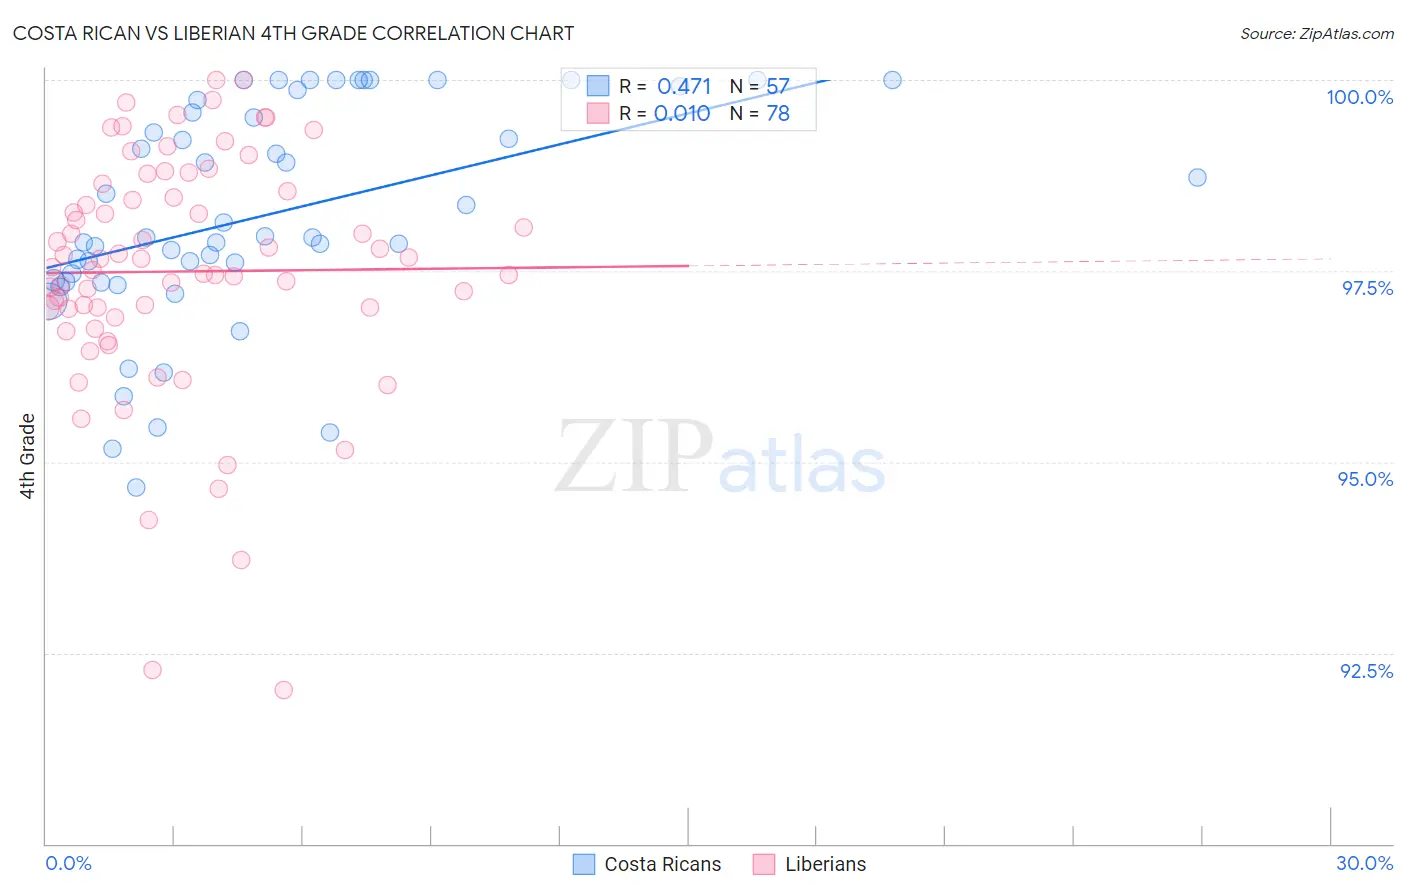
Costa Rican vs Liberian 4th Grade Correlation Chart
The statistical analysis conducted on geographies consisting of 253,599,979 people shows a moderate positive correlation between the proportion of Costa Ricans and percentage of population with at least 4th grade education in the United States with a correlation coefficient (R) of 0.471 and weighted average of 97.3%. Similarly, the statistical analysis conducted on geographies consisting of 118,098,536 people shows no correlation between the proportion of Liberians and percentage of population with at least 4th grade education in the United States with a correlation coefficient (R) of 0.010 and weighted average of 97.2%, a difference of 0.080%.
4th Grade Correlation Summary
| Measurement | Costa Rican | Liberian |
| Minimum | 94.7% | 92.0% |
| Maximum | 100.0% | 100.0% |
| Range | 5.3% | 8.0% |
| Mean | 98.2% | 97.5% |
| Median | 97.9% | 97.6% |
| Interquartile 25% (IQ1) | 97.4% | 97.0% |
| Interquartile 75% (IQ3) | 99.7% | 98.5% |
| Interquartile Range (IQR) | 2.3% | 1.5% |
| Standard Deviation (Sample) | 1.4% | 1.6% |
| Standard Deviation (Population) | 1.4% | 1.6% |
Demographics Similar to Costa Ricans and Liberians by 4th Grade
In terms of 4th grade, the demographic groups most similar to Costa Ricans are Tohono O'odham (97.3%, a difference of 0.0%), Sudanese (97.3%, a difference of 0.010%), Immigrants from Nepal (97.3%, a difference of 0.010%), Immigrants from Morocco (97.3%, a difference of 0.020%), and Samoan (97.3%, a difference of 0.020%). Similarly, the demographic groups most similar to Liberians are Immigrants from Pakistan (97.2%, a difference of 0.0%), Subsaharan African (97.2%, a difference of 0.0%), Uruguayan (97.2%, a difference of 0.0%), Bahamian (97.2%, a difference of 0.010%), and Immigrants from Malaysia (97.2%, a difference of 0.010%).
| Demographics | Rating | Rank | 4th Grade |
| Sudanese | 9.0 /100 | #211 | Tragic 97.3% |
| Tohono O'odham | 8.4 /100 | #212 | Tragic 97.3% |
| Costa Ricans | 8.3 /100 | #213 | Tragic 97.3% |
| Immigrants | Nepal | 7.7 /100 | #214 | Tragic 97.3% |
| Immigrants | Morocco | 7.1 /100 | #215 | Tragic 97.3% |
| Samoans | 6.8 /100 | #216 | Tragic 97.3% |
| Sierra Leoneans | 6.5 /100 | #217 | Tragic 97.3% |
| Iraqis | 6.3 /100 | #218 | Tragic 97.3% |
| Tongans | 5.8 /100 | #219 | Tragic 97.3% |
| South American Indians | 5.5 /100 | #220 | Tragic 97.3% |
| Immigrants | Panama | 5.4 /100 | #221 | Tragic 97.3% |
| Immigrants | Lebanon | 5.1 /100 | #222 | Tragic 97.3% |
| Immigrants | Sudan | 5.0 /100 | #223 | Tragic 97.2% |
| Immigrants | Syria | 5.0 /100 | #224 | Tragic 97.2% |
| Immigrants | Iraq | 4.6 /100 | #225 | Tragic 97.2% |
| Bahamians | 3.8 /100 | #226 | Tragic 97.2% |
| Immigrants | Pakistan | 3.7 /100 | #227 | Tragic 97.2% |
| Sub-Saharan Africans | 3.6 /100 | #228 | Tragic 97.2% |
| Liberians | 3.6 /100 | #229 | Tragic 97.2% |
| Uruguayans | 3.5 /100 | #230 | Tragic 97.2% |
| Immigrants | Malaysia | 3.4 /100 | #231 | Tragic 97.2% |