Costa Rican vs Inupiat 3rd Grade
COMPARE
Costa Rican
Inupiat
3rd Grade
3rd Grade Comparison
Costa Ricans
Inupiat
97.6%
3RD GRADE
9.6/ 100
METRIC RATING
209th/ 347
METRIC RANK
98.8%
3RD GRADE
100.0/ 100
METRIC RATING
4th/ 347
METRIC RANK
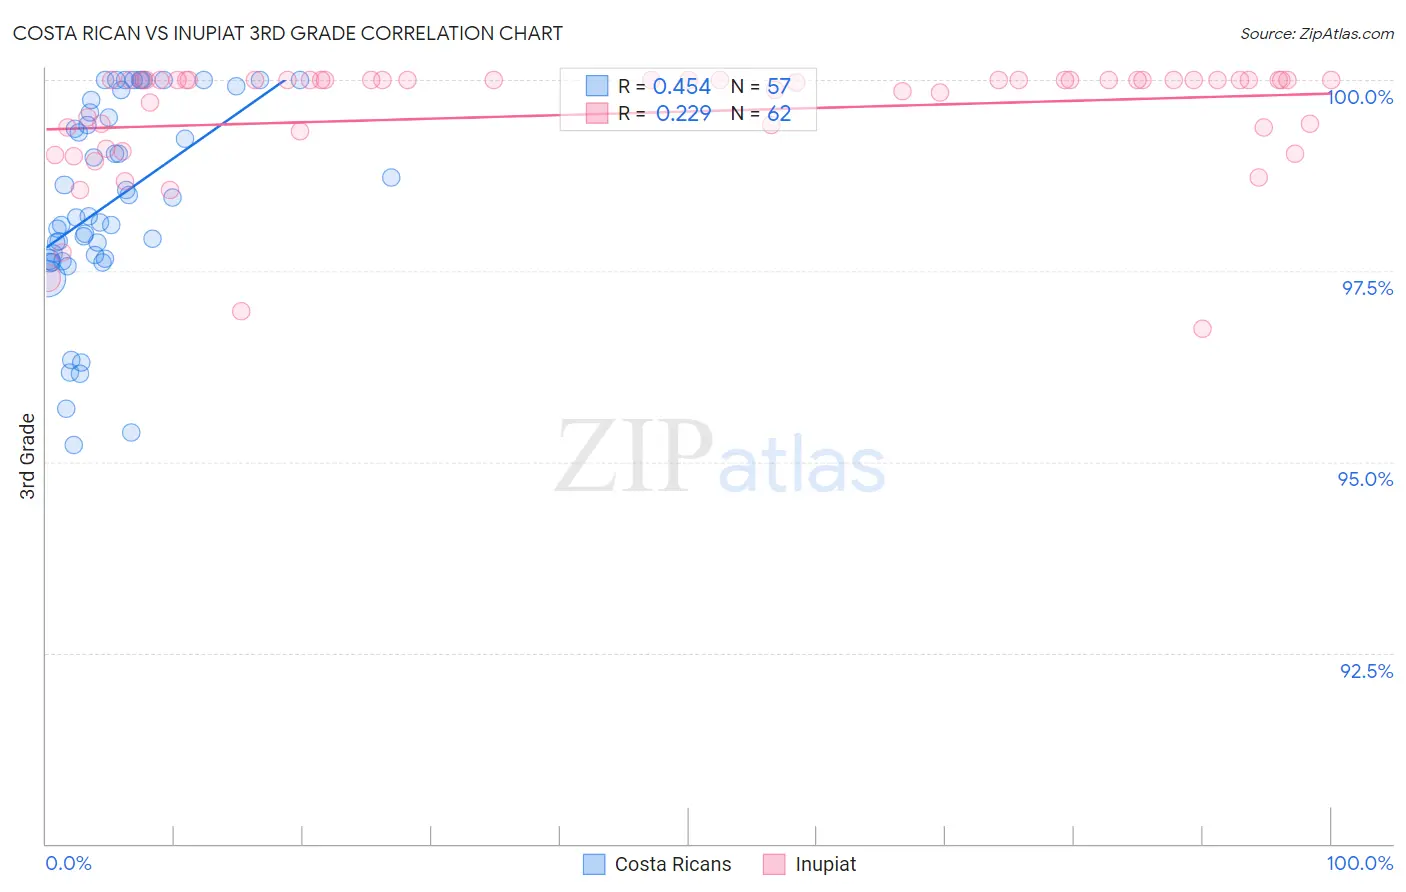
Costa Rican vs Inupiat 3rd Grade Correlation Chart
The statistical analysis conducted on geographies consisting of 253,599,979 people shows a moderate positive correlation between the proportion of Costa Ricans and percentage of population with at least 3rd grade education in the United States with a correlation coefficient (R) of 0.454 and weighted average of 97.6%. Similarly, the statistical analysis conducted on geographies consisting of 96,348,974 people shows a weak positive correlation between the proportion of Inupiat and percentage of population with at least 3rd grade education in the United States with a correlation coefficient (R) of 0.229 and weighted average of 98.8%, a difference of 1.2%.
3rd Grade Correlation Summary
| Measurement | Costa Rican | Inupiat |
| Minimum | 95.2% | 96.7% |
| Maximum | 100.0% | 100.0% |
| Range | 4.8% | 3.3% |
| Mean | 98.4% | 99.6% |
| Median | 98.2% | 100.0% |
| Interquartile 25% (IQ1) | 97.7% | 99.4% |
| Interquartile 75% (IQ3) | 99.7% | 100.0% |
| Interquartile Range (IQR) | 2.0% | 0.62% |
| Standard Deviation (Sample) | 1.3% | 0.76% |
| Standard Deviation (Population) | 1.3% | 0.76% |
Similar Demographics by 3rd Grade
Demographics Similar to Costa Ricans by 3rd Grade
In terms of 3rd grade, the demographic groups most similar to Costa Ricans are Immigrants from Oceania (97.6%, a difference of 0.0%), Laotian (97.6%, a difference of 0.0%), Immigrants from Bahamas (97.6%, a difference of 0.010%), Moroccan (97.6%, a difference of 0.010%), and Yuman (97.6%, a difference of 0.010%).
| Demographics | Rating | Rank | 3rd Grade |
| Immigrants | Southern Europe | 17.7 /100 | #202 | Poor 97.6% |
| Paiute | 16.7 /100 | #203 | Poor 97.6% |
| Immigrants | Chile | 16.5 /100 | #204 | Poor 97.6% |
| Africans | 14.5 /100 | #205 | Poor 97.6% |
| Immigrants | Northern Africa | 13.0 /100 | #206 | Poor 97.6% |
| Tohono O'odham | 12.5 /100 | #207 | Poor 97.6% |
| Immigrants | Zaire | 11.9 /100 | #208 | Poor 97.6% |
| Costa Ricans | 9.6 /100 | #209 | Tragic 97.6% |
| Immigrants | Oceania | 9.5 /100 | #210 | Tragic 97.6% |
| Laotians | 9.4 /100 | #211 | Tragic 97.6% |
| Immigrants | Bahamas | 8.5 /100 | #212 | Tragic 97.6% |
| Moroccans | 8.5 /100 | #213 | Tragic 97.6% |
| Yuman | 8.4 /100 | #214 | Tragic 97.6% |
| Iraqis | 6.9 /100 | #215 | Tragic 97.5% |
| Samoans | 6.9 /100 | #216 | Tragic 97.5% |
Demographics Similar to Inupiat by 3rd Grade
In terms of 3rd grade, the demographic groups most similar to Inupiat are Tsimshian (98.8%, a difference of 0.010%), Welsh (98.8%, a difference of 0.030%), Alaskan Athabascan (98.7%, a difference of 0.11%), Norwegian (98.6%, a difference of 0.15%), and Slovak (98.6%, a difference of 0.16%).
| Demographics | Rating | Rank | 3rd Grade |
| Crow | 100.0 /100 | #1 | Exceptional 99.6% |
| Yup'ik | 100.0 /100 | #2 | Exceptional 99.0% |
| Welsh | 100.0 /100 | #3 | Exceptional 98.8% |
| Inupiat | 100.0 /100 | #4 | Exceptional 98.8% |
| Tsimshian | 100.0 /100 | #5 | Exceptional 98.8% |
| Alaskan Athabascans | 100.0 /100 | #6 | Exceptional 98.7% |
| Norwegians | 100.0 /100 | #7 | Exceptional 98.6% |
| Slovaks | 100.0 /100 | #8 | Exceptional 98.6% |
| Germans | 100.0 /100 | #9 | Exceptional 98.6% |
| Alaska Natives | 100.0 /100 | #10 | Exceptional 98.6% |
| Slovenes | 100.0 /100 | #11 | Exceptional 98.6% |
| English | 100.0 /100 | #12 | Exceptional 98.6% |
| Tlingit-Haida | 100.0 /100 | #13 | Exceptional 98.5% |
| Carpatho Rusyns | 100.0 /100 | #14 | Exceptional 98.5% |
| Swedes | 100.0 /100 | #15 | Exceptional 98.5% |