Costa Rican vs Immigrants from Zaire 1st Grade
COMPARE
Costa Rican
Immigrants from Zaire
1st Grade
1st Grade Comparison
Costa Ricans
Immigrants from Zaire
97.8%
1ST GRADE
11.6/ 100
METRIC RATING
209th/ 347
METRIC RANK
97.7%
1ST GRADE
4.1/ 100
METRIC RATING
223rd/ 347
METRIC RANK
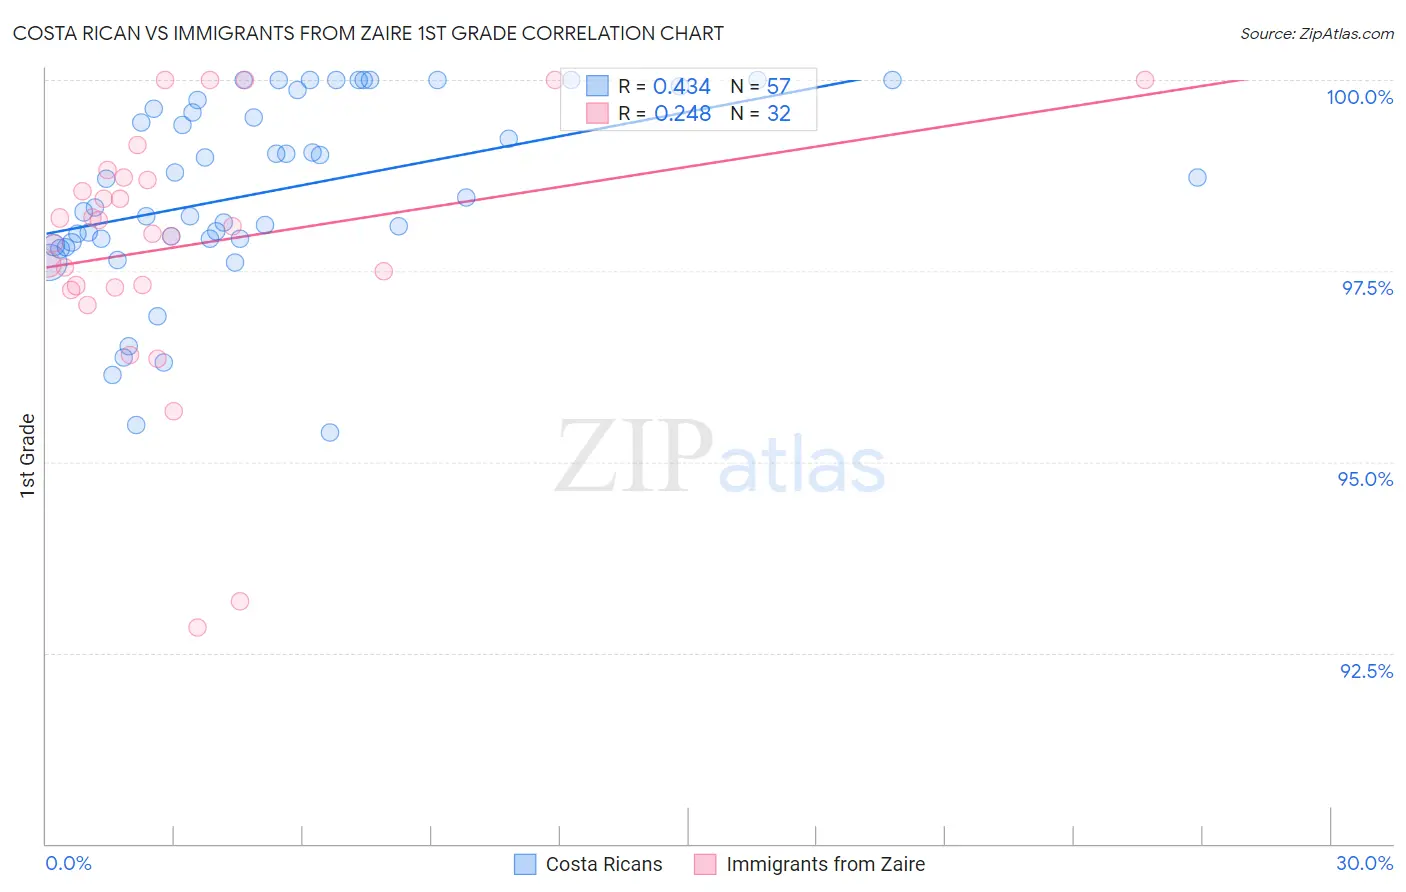
Costa Rican vs Immigrants from Zaire 1st Grade Correlation Chart
The statistical analysis conducted on geographies consisting of 253,599,979 people shows a moderate positive correlation between the proportion of Costa Ricans and percentage of population with at least 1st grade education in the United States with a correlation coefficient (R) of 0.434 and weighted average of 97.8%. Similarly, the statistical analysis conducted on geographies consisting of 107,255,805 people shows a weak positive correlation between the proportion of Immigrants from Zaire and percentage of population with at least 1st grade education in the United States with a correlation coefficient (R) of 0.248 and weighted average of 97.7%, a difference of 0.090%.
1st Grade Correlation Summary
| Measurement | Costa Rican | Immigrants from Zaire |
| Minimum | 95.4% | 92.8% |
| Maximum | 100.0% | 100.0% |
| Range | 4.6% | 7.2% |
| Mean | 98.5% | 97.8% |
| Median | 98.5% | 98.0% |
| Interquartile 25% (IQ1) | 97.9% | 97.3% |
| Interquartile 75% (IQ3) | 99.7% | 98.7% |
| Interquartile Range (IQR) | 1.8% | 1.4% |
| Standard Deviation (Sample) | 1.2% | 1.7% |
| Standard Deviation (Population) | 1.2% | 1.7% |
Demographics Similar to Costa Ricans and Immigrants from Zaire by 1st Grade
In terms of 1st grade, the demographic groups most similar to Costa Ricans are Immigrants from Northern Africa (97.8%, a difference of 0.0%), Immigrants from Oceania (97.8%, a difference of 0.0%), Laotian (97.8%, a difference of 0.010%), Moroccan (97.7%, a difference of 0.020%), and African (97.8%, a difference of 0.030%). Similarly, the demographic groups most similar to Immigrants from Zaire are Immigrants from Sudan (97.7%, a difference of 0.0%), Immigrants from Syria (97.7%, a difference of 0.0%), Iraqi (97.7%, a difference of 0.0%), Immigrants from Nepal (97.7%, a difference of 0.0%), and Tongan (97.7%, a difference of 0.010%).
| Demographics | Rating | Rank | 1st Grade |
| Immigrants | Albania | 17.3 /100 | #206 | Poor 97.8% |
| Africans | 16.5 /100 | #207 | Poor 97.8% |
| Immigrants | Northern Africa | 12.0 /100 | #208 | Poor 97.8% |
| Costa Ricans | 11.6 /100 | #209 | Poor 97.8% |
| Immigrants | Oceania | 11.0 /100 | #210 | Poor 97.8% |
| Laotians | 10.3 /100 | #211 | Poor 97.8% |
| Moroccans | 8.7 /100 | #212 | Tragic 97.7% |
| Immigrants | Bahamas | 8.1 /100 | #213 | Tragic 97.7% |
| South American Indians | 7.6 /100 | #214 | Tragic 97.7% |
| Bahamians | 7.5 /100 | #215 | Tragic 97.7% |
| Uruguayans | 7.4 /100 | #216 | Tragic 97.7% |
| Samoans | 6.8 /100 | #217 | Tragic 97.7% |
| Immigrants | Morocco | 5.3 /100 | #218 | Tragic 97.7% |
| Immigrants | Panama | 5.2 /100 | #219 | Tragic 97.7% |
| Tongans | 4.6 /100 | #220 | Tragic 97.7% |
| Immigrants | Sudan | 4.3 /100 | #221 | Tragic 97.7% |
| Immigrants | Syria | 4.2 /100 | #222 | Tragic 97.7% |
| Immigrants | Zaire | 4.1 /100 | #223 | Tragic 97.7% |
| Iraqis | 4.0 /100 | #224 | Tragic 97.7% |
| Immigrants | Nepal | 4.0 /100 | #225 | Tragic 97.7% |
| Sudanese | 3.7 /100 | #226 | Tragic 97.7% |