Comanche vs Nepalese 4th Grade
COMPARE
Comanche
Nepalese
4th Grade
4th Grade Comparison
Comanche
Nepalese
97.5%
4TH GRADE
45.3/ 100
METRIC RATING
178th/ 347
METRIC RANK
95.5%
4TH GRADE
0.0/ 100
METRIC RATING
338th/ 347
METRIC RANK
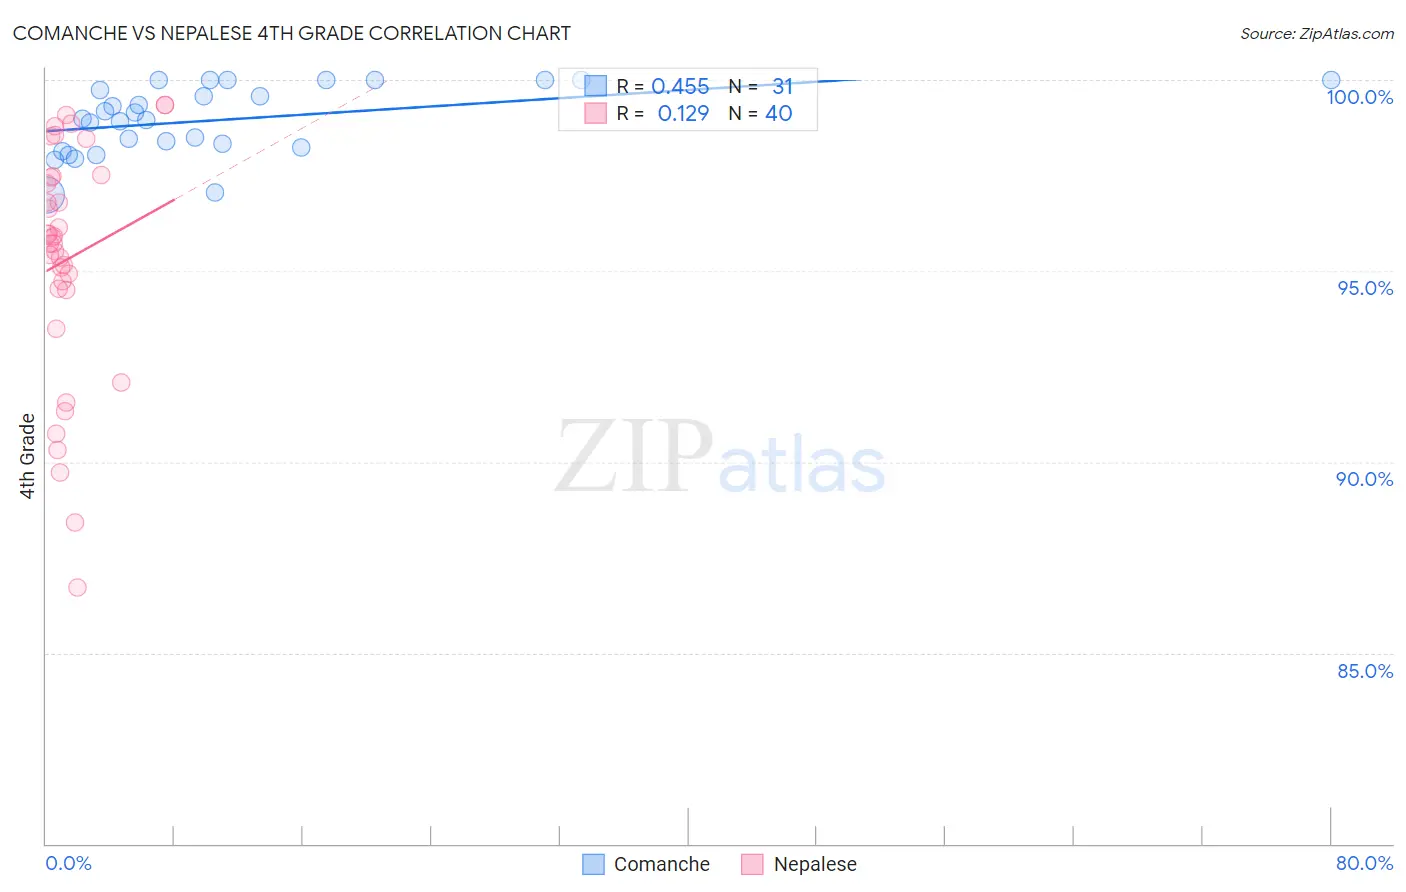
Comanche vs Nepalese 4th Grade Correlation Chart
The statistical analysis conducted on geographies consisting of 109,786,530 people shows a moderate positive correlation between the proportion of Comanche and percentage of population with at least 4th grade education in the United States with a correlation coefficient (R) of 0.455 and weighted average of 97.5%. Similarly, the statistical analysis conducted on geographies consisting of 24,521,755 people shows a poor positive correlation between the proportion of Nepalese and percentage of population with at least 4th grade education in the United States with a correlation coefficient (R) of 0.129 and weighted average of 95.5%, a difference of 2.1%.
4th Grade Correlation Summary
| Measurement | Comanche | Nepalese |
| Minimum | 97.0% | 86.7% |
| Maximum | 100.0% | 99.3% |
| Range | 3.0% | 12.6% |
| Mean | 99.0% | 95.3% |
| Median | 99.0% | 95.8% |
| Interquartile 25% (IQ1) | 98.2% | 94.5% |
| Interquartile 75% (IQ3) | 100.0% | 97.5% |
| Interquartile Range (IQR) | 1.8% | 2.9% |
| Standard Deviation (Sample) | 0.90% | 3.1% |
| Standard Deviation (Population) | 0.88% | 3.1% |
Similar Demographics by 4th Grade
Demographics Similar to Comanche by 4th Grade
In terms of 4th grade, the demographic groups most similar to Comanche are Immigrants from Brazil (97.5%, a difference of 0.0%), Arab (97.5%, a difference of 0.010%), Immigrants from Kazakhstan (97.5%, a difference of 0.010%), Immigrants from Venezuela (97.5%, a difference of 0.010%), and Immigrants from Taiwan (97.5%, a difference of 0.010%).
| Demographics | Rating | Rank | 4th Grade |
| Brazilians | 51.5 /100 | #171 | Average 97.5% |
| Immigrants | Sri Lanka | 51.1 /100 | #172 | Average 97.5% |
| Immigrants | Korea | 50.6 /100 | #173 | Average 97.5% |
| Egyptians | 50.0 /100 | #174 | Average 97.5% |
| Immigrants | Micronesia | 49.6 /100 | #175 | Average 97.5% |
| Arabs | 48.7 /100 | #176 | Average 97.5% |
| Immigrants | Brazil | 46.1 /100 | #177 | Average 97.5% |
| Comanche | 45.3 /100 | #178 | Average 97.5% |
| Immigrants | Kazakhstan | 43.6 /100 | #179 | Average 97.5% |
| Immigrants | Venezuela | 42.7 /100 | #180 | Average 97.5% |
| Immigrants | Taiwan | 41.5 /100 | #181 | Average 97.5% |
| Spanish Americans | 39.3 /100 | #182 | Fair 97.5% |
| Argentineans | 39.0 /100 | #183 | Fair 97.5% |
| Pakistanis | 36.2 /100 | #184 | Fair 97.5% |
| Immigrants | Kenya | 35.8 /100 | #185 | Fair 97.5% |
Demographics Similar to Nepalese by 4th Grade
In terms of 4th grade, the demographic groups most similar to Nepalese are Central American (95.5%, a difference of 0.0%), Mexican (95.6%, a difference of 0.13%), Immigrants from Latin America (95.7%, a difference of 0.20%), Guatemalan (95.3%, a difference of 0.20%), and Immigrants from Dominican Republic (95.7%, a difference of 0.26%).
| Demographics | Rating | Rank | 4th Grade |
| Immigrants | Armenia | 0.0 /100 | #331 | Tragic 95.8% |
| Immigrants | Honduras | 0.0 /100 | #332 | Tragic 95.8% |
| Immigrants | Dominican Republic | 0.0 /100 | #333 | Tragic 95.7% |
| Immigrants | Cabo Verde | 0.0 /100 | #334 | Tragic 95.7% |
| Immigrants | Latin America | 0.0 /100 | #335 | Tragic 95.7% |
| Mexicans | 0.0 /100 | #336 | Tragic 95.6% |
| Central Americans | 0.0 /100 | #337 | Tragic 95.5% |
| Nepalese | 0.0 /100 | #338 | Tragic 95.5% |
| Guatemalans | 0.0 /100 | #339 | Tragic 95.3% |
| Yakama | 0.0 /100 | #340 | Tragic 95.2% |
| Immigrants | Yemen | 0.0 /100 | #341 | Tragic 95.2% |
| Immigrants | Central America | 0.0 /100 | #342 | Tragic 95.1% |
| Immigrants | Guatemala | 0.0 /100 | #343 | Tragic 95.1% |
| Immigrants | Mexico | 0.0 /100 | #344 | Tragic 95.1% |
| Salvadorans | 0.0 /100 | #345 | Tragic 95.0% |