Colville vs Immigrants from Oceania 2nd Grade

COMPARE

Colville
Race
Ancestry
AfghanAfricanAlaska NativeAlaskan AthabascanAlbanianAleutAlsatianAmericanApacheArabArapahoArgentineanArmenianAssyrian/Chaldean/SyriacAustralianAustrianBahamianBangladeshiBarbadianBasqueBelgianBelizeanBermudanBhutaneseBlackfeetBolivianBrazilianBritishBritish West IndianBulgarianBurmeseCajunCambodianCanadianCape VerdeanCarpatho RusynCelticCentral AmericanCentral American IndianCherokeeCheyenneChickasawChileanChineseChippewaChoctawColombianColvilleComancheCosta RicanCreeCreekCroatianCrowCubanCypriotCzechCzechoslovakianDanishDelawareDominicanDutchDutch West IndianEastern EuropeanEcuadorianEgyptianEnglishEstonianEthiopianEuropeanFijianFilipinoFinnishFrenchFrench American IndianFrench CanadianGermanGerman RussianGhanaianGreekGuamanian/ChamorroGuatemalanGuyaneseHaitianHmongHonduranHopiHoumaHungarianIcelanderIndian (Asian)IndonesianInupiatIranianIraqiIrishIroquoisIsraeliItalianJamaicanJapaneseJordanianKenyanKiowaKoreanLaotianLatvianLebaneseLiberianLithuanianLumbeeLuxembourgerMacedonianMalaysianMalteseMarshalleseMenomineeMexicanMexican American IndianMongolianMoroccanNative HawaiianNavajoNepaleseNew ZealanderNicaraguanNigerianNorthern EuropeanNorwegianOkinawanOsageOttawaPaiutePakistaniPalestinianPanamanianParaguayanPennsylvania GermanPeruvianPimaPolishPortuguesePotawatomiPuebloPuerto RicanPuget Sound SalishRomanianRussianSalvadoranSamoanScandinavianScotch-IrishScottishSeminoleSenegaleseSerbianShoshoneSierra LeoneanSiouxSlavicSlovakSloveneSomaliSouth AfricanSouth AmericanSouth American IndianSoviet UnionSpaniardSpanishSpanish AmericanSpanish American IndianSri LankanSubsaharan AfricanSudaneseSwedishSwissSyrianTaiwaneseThaiTlingit-HaidaTohono O'OdhamTonganTrinidadian and TobagonianTsimshianTurkishU.S. Virgin IslanderUgandanUkrainianUruguayanUteVenezuelanVietnameseWelshWest IndianYakamaYaquiYugoslavianYumanYup'ikZimbabwean
Immigration
NonimmigrantsImmigrantsAfghanistanAfricaAlbaniaArgentinaArmeniaAsiaAustraliaAustriaBahamasBangladeshBarbadosBelarusBelgiumBelizeBoliviaBosnia and HerzegovinaBrazilBulgariaBurma/MyanmarCabo VerdeCambodiaCameroonCanadaCaribbeanCentral AmericaChileChinaColombiaCongoCosta RicaCroatiaCubaCzechoslovakiaDenmarkDominicaDominican RepublicEastern AfricaEastern AsiaEastern EuropeEcuadorEgyptEl SalvadorEnglandEritreaEthiopiaEuropeFijiFranceGermanyGhanaGreeceGrenadaGuatemalaGuyanaHaitiHondurasHong KongHungaryIndiaIndonesiaIranIraqIrelandIsraelItalyJamaicaJapanJordanKazakhstanKenyaKoreaKuwaitLaosLatin AmericaLatviaLebanonLiberiaLithuaniaMalaysiaMexicoMicronesiaMiddle AfricaMoldovaMoroccoNepalNetherlandsNicaraguaNigeriaNorth AmericaNorth MacedoniaNorthern AfricaNorthern EuropeNorwayPakistanPanamaPeruPhilippinesPolandPortugalRomaniaRussiaSaudi ArabiaScotlandSenegalSerbiaSierra LeoneSingaporeSomaliaSouth AfricaSouth AmericaSouth Central AsiaSouth Eastern AsiaSouthern EuropeSpainSri LankaSt. Vincent and the GrenadinesSudanSwedenSwitzerlandSyriaTaiwanThailandTrinidad and TobagoTurkeyUgandaUkraineUruguayUzbekistanVenezuelaVietnamWest IndiesWestern AfricaWestern AsiaWestern EuropeYemenZaireZimbabweAzores
Immigrants from Oceania
Race
Ancestry
AfghanAfricanAlaska NativeAlaskan AthabascanAlbanianAleutAlsatianAmericanApacheArabArapahoArgentineanArmenianAssyrian/Chaldean/SyriacAustralianAustrianBahamianBangladeshiBarbadianBasqueBelgianBelizeanBermudanBhutaneseBlackfeetBolivianBrazilianBritishBritish West IndianBulgarianBurmeseCajunCambodianCanadianCape VerdeanCarpatho RusynCelticCentral AmericanCentral American IndianCherokeeCheyenneChickasawChileanChineseChippewaChoctawColombianComancheCosta RicanCreeCreekCroatianCrowCubanCypriotCzechCzechoslovakianDanishDelawareDominicanDutchDutch West IndianEastern EuropeanEcuadorianEgyptianEnglishEstonianEthiopianEuropeanFijianFilipinoFinnishFrenchFrench American IndianFrench CanadianGermanGerman RussianGhanaianGreekGuamanian/ChamorroGuatemalanGuyaneseHaitianHmongHonduranHopiHoumaHungarianIcelanderIndian (Asian)IndonesianInupiatIranianIraqiIrishIroquoisIsraeliItalianJamaicanJapaneseJordanianKenyanKiowaKoreanLaotianLatvianLebaneseLiberianLithuanianLumbeeLuxembourgerMacedonianMalaysianMalteseMarshalleseMenomineeMexicanMexican American IndianMongolianMoroccanNative HawaiianNavajoNepaleseNew ZealanderNicaraguanNigerianNorthern EuropeanNorwegianOkinawanOsageOttawaPaiutePakistaniPalestinianPanamanianParaguayanPennsylvania GermanPeruvianPimaPolishPortuguesePotawatomiPuebloPuerto RicanPuget Sound SalishRomanianRussianSalvadoranSamoanScandinavianScotch-IrishScottishSeminoleSenegaleseSerbianShoshoneSierra LeoneanSiouxSlavicSlovakSloveneSomaliSouth AfricanSouth AmericanSouth American IndianSoviet UnionSpaniardSpanishSpanish AmericanSpanish American IndianSri LankanSubsaharan AfricanSudaneseSwedishSwissSyrianTaiwaneseThaiTlingit-HaidaTohono O'OdhamTonganTrinidadian and TobagonianTsimshianTurkishU.S. Virgin IslanderUgandanUkrainianUruguayanUteVenezuelanVietnameseWelshWest IndianYakamaYaquiYugoslavianYumanYup'ikZimbabwean
Immigration
NonimmigrantsImmigrantsAfghanistanAfricaAlbaniaArgentinaArmeniaAsiaAustraliaAustriaBahamasBangladeshBarbadosBelarusBelgiumBelizeBoliviaBosnia and HerzegovinaBrazilBulgariaBurma/MyanmarCabo VerdeCambodiaCameroonCanadaCaribbeanCentral AmericaChileChinaColombiaCongoCosta RicaCroatiaCubaCzechoslovakiaDenmarkDominicaDominican RepublicEastern AfricaEastern AsiaEastern EuropeEcuadorEgyptEl SalvadorEnglandEritreaEthiopiaEuropeFijiFranceGermanyGhanaGreeceGrenadaGuatemalaGuyanaHaitiHondurasHong KongHungaryIndiaIndonesiaIranIraqIrelandIsraelItalyJamaicaJapanJordanKazakhstanKenyaKoreaKuwaitLaosLatin AmericaLatviaLebanonLiberiaLithuaniaMalaysiaMexicoMicronesiaMiddle AfricaMoldovaMoroccoNepalNetherlandsNicaraguaNigeriaNorth AmericaNorth MacedoniaNorthern AfricaNorthern EuropeNorwayOceaniaPakistanPanamaPeruPhilippinesPolandPortugalRomaniaRussiaSaudi ArabiaScotlandSenegalSerbiaSierra LeoneSingaporeSomaliaSouth AfricaSouth AmericaSouth Central AsiaSouth Eastern AsiaSouthern EuropeSpainSri LankaSt. Vincent and the GrenadinesSudanSwedenSwitzerlandSyriaTaiwanThailandTrinidad and TobagoTurkeyUgandaUkraineUruguayUzbekistanVenezuelaVietnamWest IndiesWestern AfricaWestern AsiaWestern EuropeYemenZaireZimbabweAzores
2nd Grade
Income
Poverty
Unemployment
Labor Participation
Family Structure
Vehicle Availability
Education Level
Disability

2nd Grade Comparison

Colville

Immigrants from Oceania

Exceptional
Poor
98.1%
2ND GRADE
96.6/ 100
METRIC RATING
112th/ 347
METRIC RANK
97.7%
2ND GRADE
10.9/ 100
METRIC RATING
209th/ 347
METRIC RANK

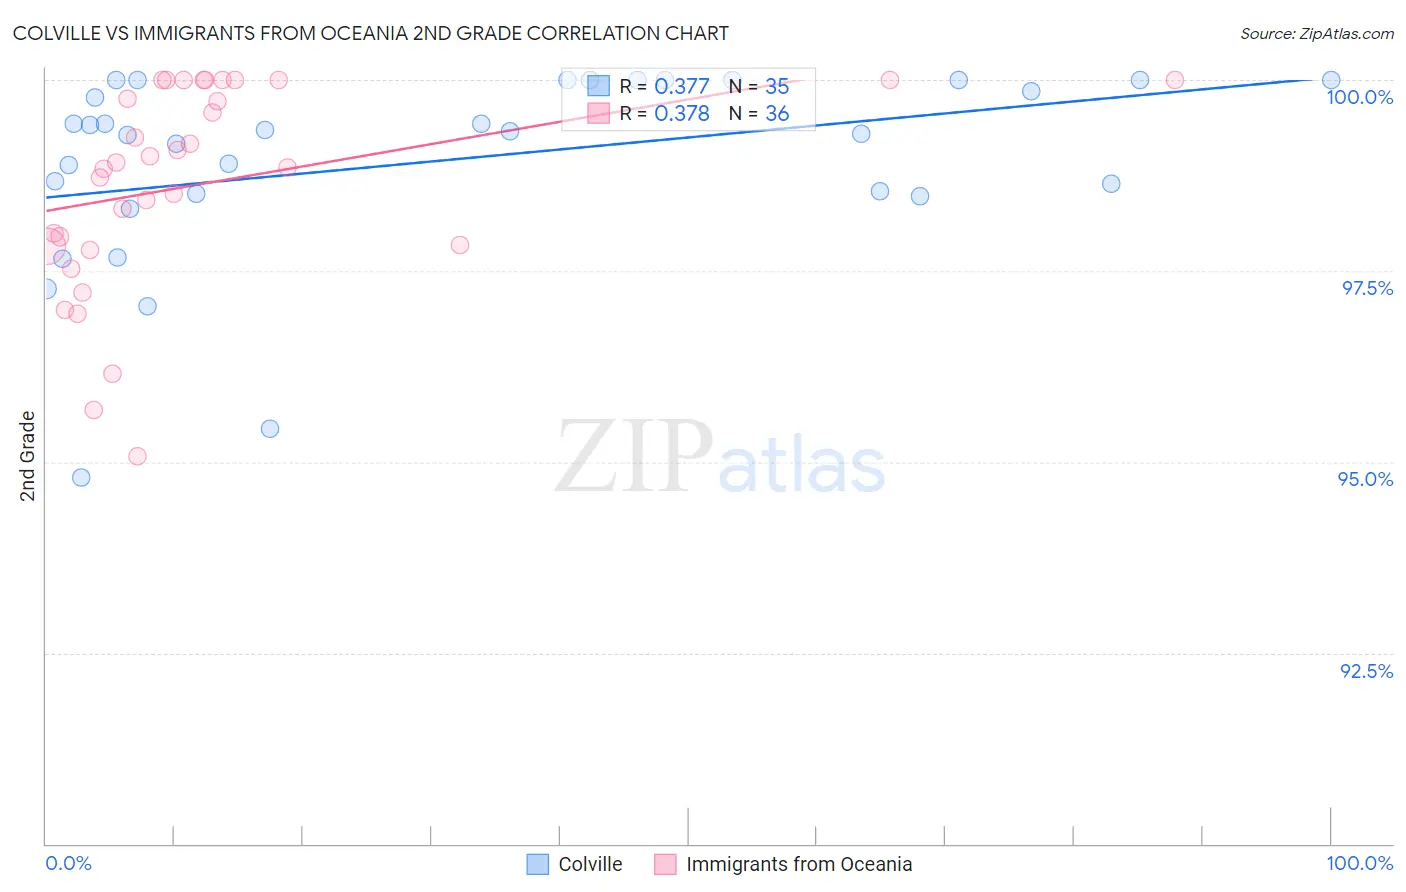
Colville vs Immigrants from Oceania 2nd Grade Correlation Chart

The statistical analysis conducted on geographies consisting of 34,687,839 people shows a mild positive correlation between the proportion of Colville and percentage of population with at least 2nd grade education in the United States with a correlation coefficient (R) of 0.377 and weighted average of 98.1%. Similarly, the statistical analysis conducted on geographies consisting of 305,516,300 people shows a mild positive correlation between the proportion of Immigrants from Oceania and percentage of population with at least 2nd grade education in the United States with a correlation coefficient (R) of 0.378 and weighted average of 97.7%, a difference of 0.43%.
Colville vs Immigrants from Oceania 2nd Grade

2nd Grade Correlation Summary

MeasurementColvilleImmigrants from Oceania
Minimum94.8%95.1%
Maximum100.0%100.0%
Range5.2%4.9%
Mean98.9%98.6%
Median99.3%98.9%
Interquartile 25% (IQ1)98.5%97.8%
Interquartile 75% (IQ3)100.0%100.0%
Interquartile Range (IQR)1.5%2.2%
Standard Deviation (Sample)1.3%1.3%
Standard Deviation (Population)1.2%1.3%

Similar Demographics by 2nd Grade

Demographics Similar to Colville by 2nd Grade

In terms of 2nd grade, the demographic groups most similar to Colville are Immigrants from Norway (98.1%, a difference of 0.0%), Basque (98.1%, a difference of 0.010%), Immigrants from Singapore (98.1%, a difference of 0.010%), Immigrants from Czechoslovakia (98.1%, a difference of 0.010%), and Immigrants from Latvia (98.1%, a difference of 0.010%).
DemographicsRating | Rank2nd Grade
Yugoslavians
97.5
/100
|
#105
Exceptional
98.2%
Bhutanese
97.5
/100
|
#106
Exceptional
98.1%
German Russians
97.4
/100
|
#107
Exceptional
98.1%
Immigrants | Switzerland
97.3
/100
|
#108
Exceptional
98.1%
Basques
97.2
/100
|
#109
Exceptional
98.1%
Immigrants | Singapore
97.0
/100
|
#110
Exceptional
98.1%
Immigrants | Czechoslovakia
96.9
/100
|
#111
Exceptional
98.1%
Colville
96.6
/100
|
#112
Exceptional
98.1%
Immigrants | Norway
96.5
/100
|
#113
Exceptional
98.1%
Immigrants | Latvia
96.4
/100
|
#114
Exceptional
98.1%
Iranians
95.9
/100
|
#115
Exceptional
98.1%
Spanish
95.8
/100
|
#116
Exceptional
98.1%
Ute
95.7
/100
|
#117
Exceptional
98.1%
Immigrants | France
95.6
/100
|
#118
Exceptional
98.1%
Thais
95.3
/100
|
#119
Exceptional
98.1%

Demographics Similar to Immigrants from Oceania by 2nd Grade

In terms of 2nd grade, the demographic groups most similar to Immigrants from Oceania are Costa Rican (97.7%, a difference of 0.0%), Immigrants from Northern Africa (97.7%, a difference of 0.010%), Laotian (97.7%, a difference of 0.010%), Immigrants from Bahamas (97.7%, a difference of 0.020%), and Moroccan (97.7%, a difference of 0.020%).
DemographicsRating | Rank2nd Grade
Immigrants | Ukraine
20.5
/100
|
#202
Fair
97.8%
Yuman
20.0
/100
|
#203
Fair
97.8%
Immigrants | Albania
18.4
/100
|
#204
Poor
97.8%
Immigrants | Southern Europe
18.1
/100
|
#205
Poor
97.8%
Immigrants | Chile
17.3
/100
|
#206
Poor
97.7%
Africans
15.6
/100
|
#207
Poor
97.7%
Immigrants | Northern Africa
12.3
/100
|
#208
Poor
97.7%
Immigrants | Oceania
10.9
/100
|
#209
Poor
97.7%
Costa Ricans
10.5
/100
|
#210
Poor
97.7%
Laotians
9.9
/100
|
#211
Tragic
97.7%
Immigrants | Bahamas
8.4
/100
|
#212
Tragic
97.7%
Moroccans
8.2
/100
|
#213
Tragic
97.7%
Samoans
7.1
/100
|
#214
Tragic
97.7%
Bahamians
6.8
/100
|
#215
Tragic
97.7%
South American Indians
6.7
/100
|
#216
Tragic
97.7%