Colville vs Immigrants from Chile 7th Grade
COMPARE
Colville
Immigrants from Chile
7th Grade
7th Grade Comparison
Colville
Immigrants from Chile
96.4%
7TH GRADE
91.7/ 100
METRIC RATING
132nd/ 347
METRIC RANK
95.7%
7TH GRADE
9.1/ 100
METRIC RATING
216th/ 347
METRIC RANK
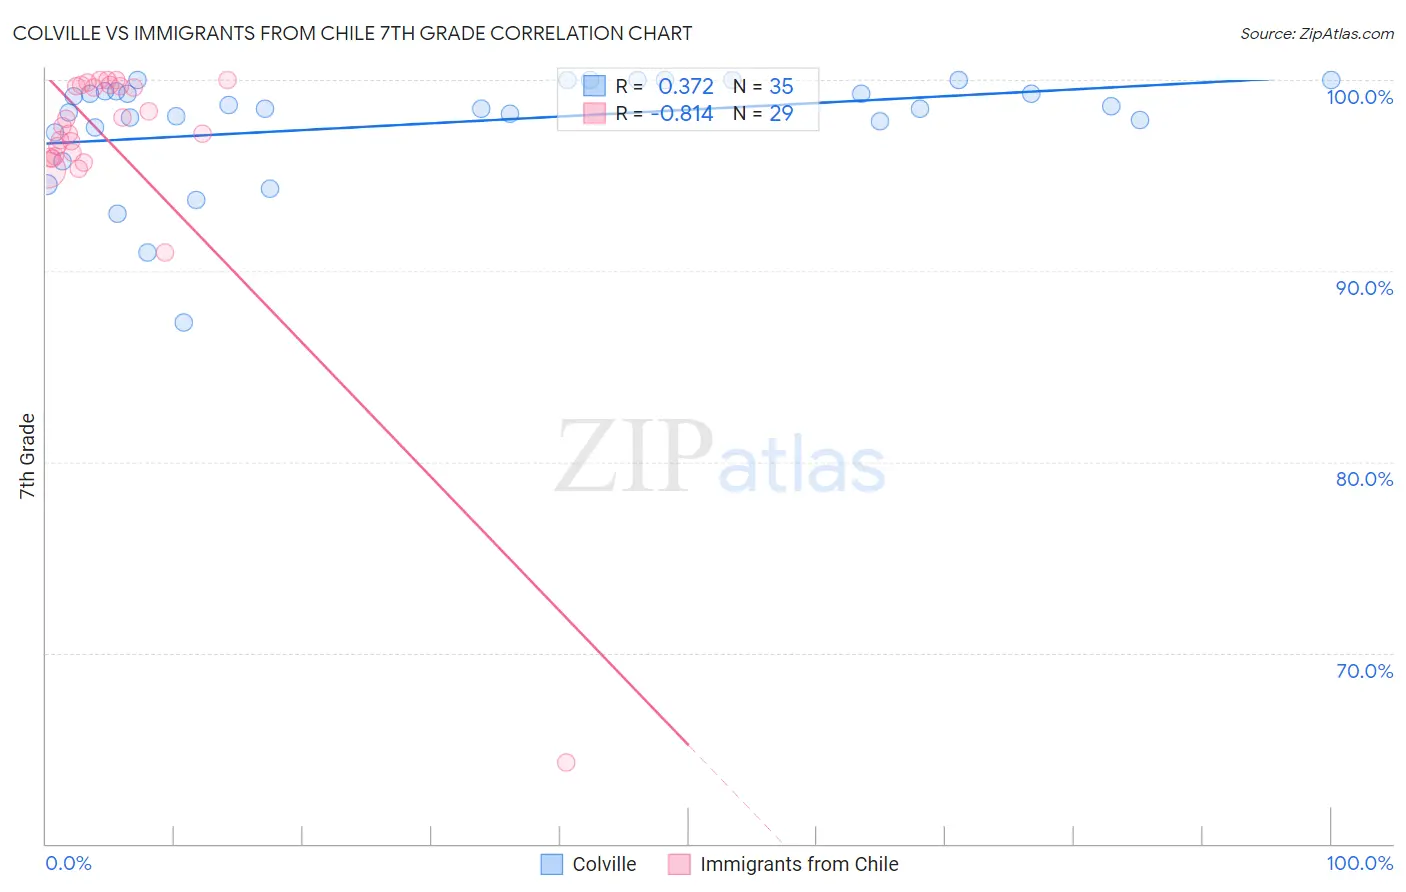
Colville vs Immigrants from Chile 7th Grade Correlation Chart
The statistical analysis conducted on geographies consisting of 34,682,094 people shows a mild positive correlation between the proportion of Colville and percentage of population with at least 7th grade education in the United States with a correlation coefficient (R) of 0.372 and weighted average of 96.4%. Similarly, the statistical analysis conducted on geographies consisting of 218,647,266 people shows a very strong negative correlation between the proportion of Immigrants from Chile and percentage of population with at least 7th grade education in the United States with a correlation coefficient (R) of -0.814 and weighted average of 95.7%, a difference of 0.73%.
7th Grade Correlation Summary
| Measurement | Colville | Immigrants from Chile |
| Minimum | 87.3% | 64.3% |
| Maximum | 100.0% | 100.0% |
| Range | 12.7% | 35.7% |
| Mean | 97.7% | 96.6% |
| Median | 98.5% | 97.6% |
| Interquartile 25% (IQ1) | 97.5% | 96.0% |
| Interquartile 75% (IQ3) | 99.4% | 99.7% |
| Interquartile Range (IQR) | 1.9% | 3.7% |
| Standard Deviation (Sample) | 2.9% | 6.6% |
| Standard Deviation (Population) | 2.8% | 6.4% |
Similar Demographics by 7th Grade
Demographics Similar to Colville by 7th Grade
In terms of 7th grade, the demographic groups most similar to Colville are Filipino (96.4%, a difference of 0.010%), Hmong (96.4%, a difference of 0.010%), Soviet Union (96.4%, a difference of 0.010%), Immigrants from Kuwait (96.4%, a difference of 0.010%), and Immigrants from Serbia (96.4%, a difference of 0.020%).
| Demographics | Rating | Rank | 7th Grade |
| Immigrants | Bulgaria | 94.0 /100 | #125 | Exceptional 96.4% |
| Palestinians | 93.5 /100 | #126 | Exceptional 96.4% |
| Immigrants | Bosnia and Herzegovina | 93.3 /100 | #127 | Exceptional 96.4% |
| Immigrants | Romania | 93.2 /100 | #128 | Exceptional 96.4% |
| Immigrants | North Macedonia | 93.1 /100 | #129 | Exceptional 96.4% |
| Immigrants | Serbia | 92.8 /100 | #130 | Exceptional 96.4% |
| Filipinos | 92.1 /100 | #131 | Exceptional 96.4% |
| Colville | 91.7 /100 | #132 | Exceptional 96.4% |
| Hmong | 91.5 /100 | #133 | Exceptional 96.4% |
| Soviet Union | 91.2 /100 | #134 | Exceptional 96.4% |
| Immigrants | Kuwait | 91.1 /100 | #135 | Exceptional 96.4% |
| Immigrants | Hungary | 90.6 /100 | #136 | Exceptional 96.4% |
| Immigrants | Turkey | 90.2 /100 | #137 | Exceptional 96.4% |
| Jordanians | 90.0 /100 | #138 | Excellent 96.4% |
| Basques | 89.3 /100 | #139 | Excellent 96.4% |
Demographics Similar to Immigrants from Chile by 7th Grade
In terms of 7th grade, the demographic groups most similar to Immigrants from Chile are Spanish American (95.7%, a difference of 0.0%), Immigrants from Pakistan (95.7%, a difference of 0.0%), Immigrants from Liberia (95.7%, a difference of 0.020%), Immigrants from Southern Europe (95.7%, a difference of 0.020%), and Bahamian (95.7%, a difference of 0.040%).
| Demographics | Rating | Rank | 7th Grade |
| Dutch West Indians | 16.1 /100 | #209 | Poor 95.8% |
| Hawaiians | 16.0 /100 | #210 | Poor 95.8% |
| Portuguese | 13.6 /100 | #211 | Poor 95.8% |
| Immigrants | Lebanon | 13.0 /100 | #212 | Poor 95.8% |
| Immigrants | Morocco | 12.6 /100 | #213 | Poor 95.8% |
| Bahamians | 11.6 /100 | #214 | Poor 95.7% |
| Spanish Americans | 9.3 /100 | #215 | Tragic 95.7% |
| Immigrants | Chile | 9.1 /100 | #216 | Tragic 95.7% |
| Immigrants | Pakistan | 9.0 /100 | #217 | Tragic 95.7% |
| Immigrants | Liberia | 8.1 /100 | #218 | Tragic 95.7% |
| Immigrants | Southern Europe | 7.9 /100 | #219 | Tragic 95.7% |
| Sub-Saharan Africans | 7.2 /100 | #220 | Tragic 95.7% |
| Samoans | 7.0 /100 | #221 | Tragic 95.7% |
| Laotians | 6.8 /100 | #222 | Tragic 95.7% |
| Immigrants | Syria | 6.7 /100 | #223 | Tragic 95.7% |