Colombian vs Belizean 6th Grade
COMPARE
Colombian
Belizean
6th Grade
6th Grade Comparison
Colombians
Belizeans
96.5%
6TH GRADE
0.9/ 100
METRIC RATING
249th/ 347
METRIC RANK
95.3%
6TH GRADE
0.0/ 100
METRIC RATING
318th/ 347
METRIC RANK
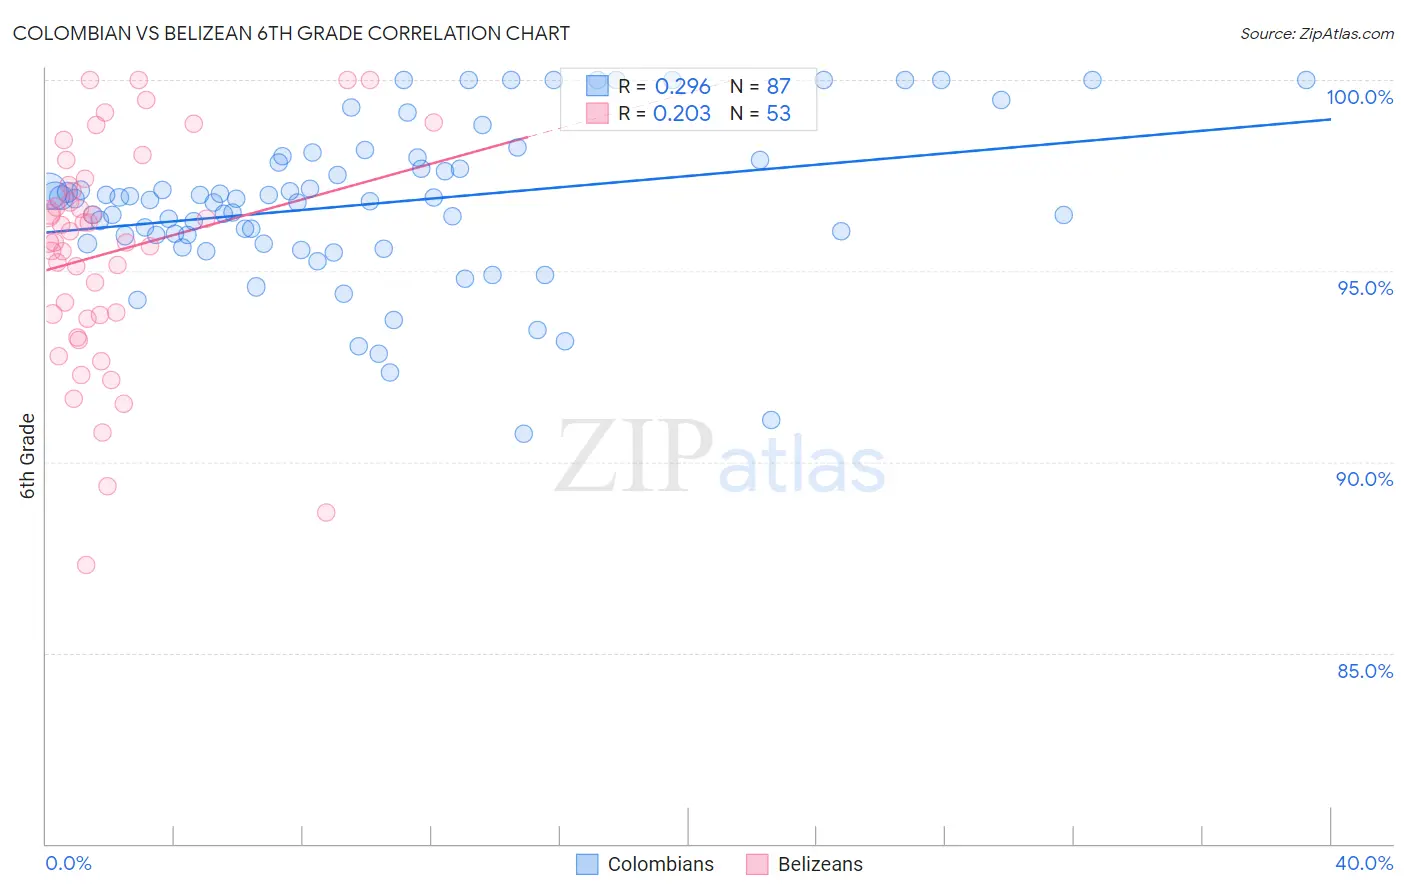
Colombian vs Belizean 6th Grade Correlation Chart
The statistical analysis conducted on geographies consisting of 419,655,116 people shows a weak positive correlation between the proportion of Colombians and percentage of population with at least 6th grade education in the United States with a correlation coefficient (R) of 0.296 and weighted average of 96.5%. Similarly, the statistical analysis conducted on geographies consisting of 144,224,236 people shows a weak positive correlation between the proportion of Belizeans and percentage of population with at least 6th grade education in the United States with a correlation coefficient (R) of 0.203 and weighted average of 95.3%, a difference of 1.3%.
6th Grade Correlation Summary
| Measurement | Colombian | Belizean |
| Minimum | 90.7% | 87.3% |
| Maximum | 100.0% | 100.0% |
| Range | 9.3% | 12.7% |
| Mean | 96.8% | 95.5% |
| Median | 96.9% | 95.8% |
| Interquartile 25% (IQ1) | 95.7% | 93.8% |
| Interquartile 75% (IQ3) | 97.9% | 97.3% |
| Interquartile Range (IQR) | 2.2% | 3.5% |
| Standard Deviation (Sample) | 2.0% | 2.9% |
| Standard Deviation (Population) | 2.0% | 2.9% |
Similar Demographics by 6th Grade
Demographics Similar to Colombians by 6th Grade
In terms of 6th grade, the demographic groups most similar to Colombians are Tohono O'odham (96.5%, a difference of 0.0%), Bolivian (96.5%, a difference of 0.010%), Immigrants from Middle Africa (96.5%, a difference of 0.020%), Immigrants from Costa Rica (96.6%, a difference of 0.040%), and Immigrants from Africa (96.6%, a difference of 0.040%).
| Demographics | Rating | Rank | 6th Grade |
| Immigrants | Asia | 1.8 /100 | #242 | Tragic 96.6% |
| Immigrants | Liberia | 1.6 /100 | #243 | Tragic 96.6% |
| Ethiopians | 1.5 /100 | #244 | Tragic 96.6% |
| Immigrants | Costa Rica | 1.3 /100 | #245 | Tragic 96.6% |
| Immigrants | Africa | 1.3 /100 | #246 | Tragic 96.6% |
| Bolivians | 1.0 /100 | #247 | Tragic 96.5% |
| Tohono O'odham | 1.0 /100 | #248 | Tragic 96.5% |
| Colombians | 0.9 /100 | #249 | Tragic 96.5% |
| Immigrants | Middle Africa | 0.8 /100 | #250 | Tragic 96.5% |
| Immigrants | Senegal | 0.7 /100 | #251 | Tragic 96.5% |
| Immigrants | Uruguay | 0.6 /100 | #252 | Tragic 96.5% |
| Jamaicans | 0.6 /100 | #253 | Tragic 96.5% |
| Immigrants | Ethiopia | 0.6 /100 | #254 | Tragic 96.5% |
| Immigrants | Congo | 0.6 /100 | #255 | Tragic 96.5% |
| U.S. Virgin Islanders | 0.5 /100 | #256 | Tragic 96.5% |
Demographics Similar to Belizeans by 6th Grade
In terms of 6th grade, the demographic groups most similar to Belizeans are Immigrants from Belize (95.3%, a difference of 0.010%), Vietnamese (95.3%, a difference of 0.020%), Immigrants from Ecuador (95.3%, a difference of 0.040%), Japanese (95.4%, a difference of 0.060%), and Immigrants from Vietnam (95.4%, a difference of 0.070%).
| Demographics | Rating | Rank | 6th Grade |
| Immigrants | Portugal | 0.0 /100 | #311 | Tragic 95.5% |
| Immigrants | Guyana | 0.0 /100 | #312 | Tragic 95.5% |
| Nicaraguans | 0.0 /100 | #313 | Tragic 95.4% |
| Immigrants | Vietnam | 0.0 /100 | #314 | Tragic 95.4% |
| Immigrants | Bangladesh | 0.0 /100 | #315 | Tragic 95.4% |
| Japanese | 0.0 /100 | #316 | Tragic 95.4% |
| Vietnamese | 0.0 /100 | #317 | Tragic 95.3% |
| Belizeans | 0.0 /100 | #318 | Tragic 95.3% |
| Immigrants | Belize | 0.0 /100 | #319 | Tragic 95.3% |
| Immigrants | Ecuador | 0.0 /100 | #320 | Tragic 95.3% |
| Immigrants | Fiji | 0.0 /100 | #321 | Tragic 95.2% |
| Immigrants | Cambodia | 0.0 /100 | #322 | Tragic 95.2% |
| Central American Indians | 0.0 /100 | #323 | Tragic 95.1% |
| Cape Verdeans | 0.0 /100 | #324 | Tragic 95.1% |
| Immigrants | Nicaragua | 0.0 /100 | #325 | Tragic 95.1% |