Choctaw vs Immigrants from Northern Europe 11th Grade
COMPARE
Choctaw
Immigrants from Northern Europe
11th Grade
11th Grade Comparison
Choctaw
Immigrants from Northern Europe
91.8%
11TH GRADE
3.7/ 100
METRIC RATING
231st/ 347
METRIC RANK
94.2%
11TH GRADE
99.9/ 100
METRIC RATING
36th/ 347
METRIC RANK
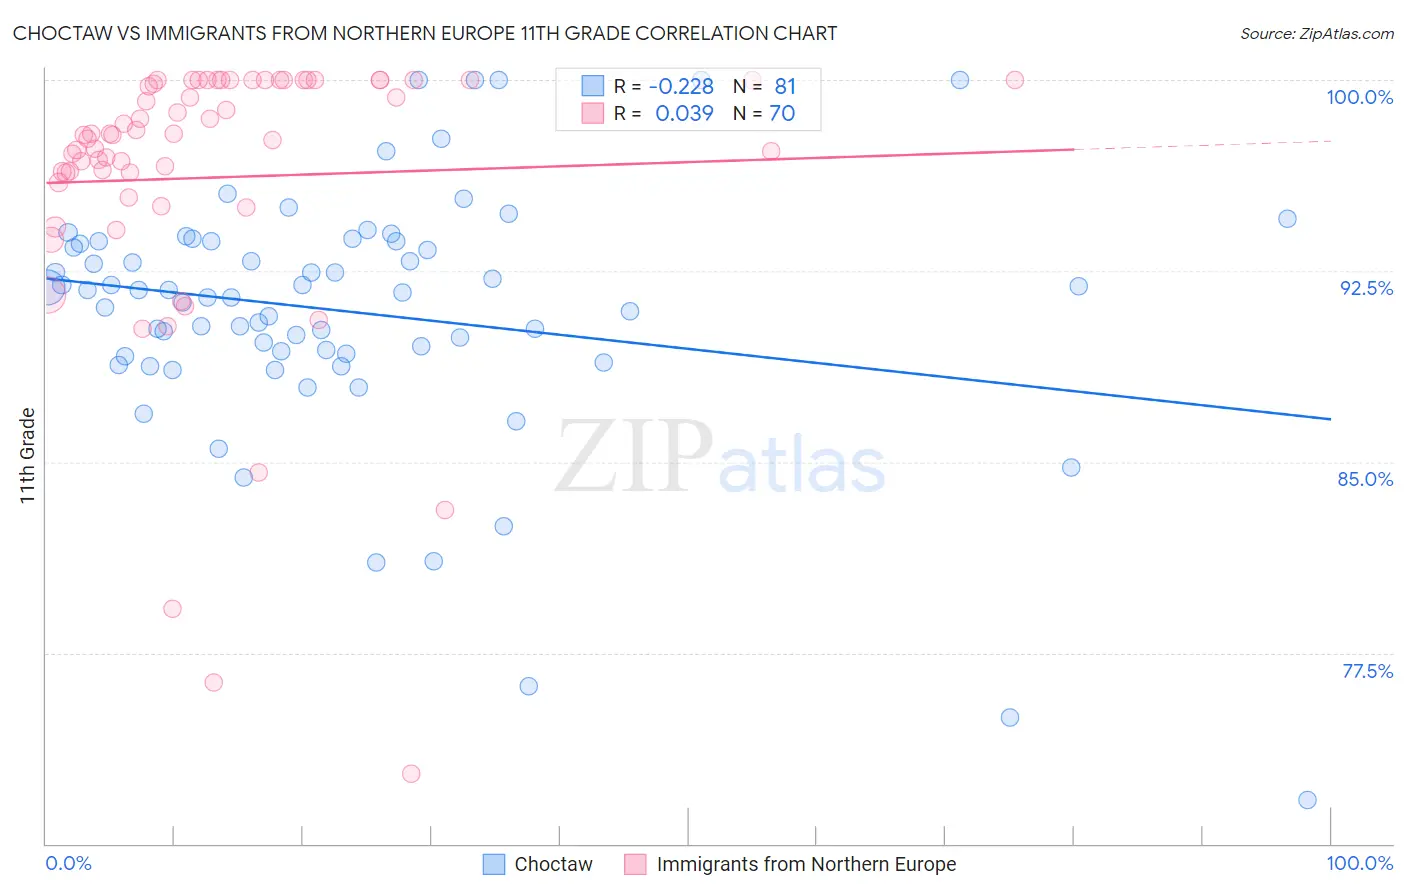
Choctaw vs Immigrants from Northern Europe 11th Grade Correlation Chart
The statistical analysis conducted on geographies consisting of 269,742,875 people shows a weak negative correlation between the proportion of Choctaw and percentage of population with at least 11th grade education in the United States with a correlation coefficient (R) of -0.228 and weighted average of 91.8%. Similarly, the statistical analysis conducted on geographies consisting of 477,226,871 people shows no correlation between the proportion of Immigrants from Northern Europe and percentage of population with at least 11th grade education in the United States with a correlation coefficient (R) of 0.039 and weighted average of 94.2%, a difference of 2.6%.
11th Grade Correlation Summary
| Measurement | Choctaw | Immigrants from Northern Europe |
| Minimum | 71.7% | 72.7% |
| Maximum | 100.0% | 100.0% |
| Range | 28.3% | 27.3% |
| Mean | 90.9% | 96.2% |
| Median | 91.7% | 97.8% |
| Interquartile 25% (IQ1) | 89.2% | 96.0% |
| Interquartile 75% (IQ3) | 93.7% | 100.0% |
| Interquartile Range (IQR) | 4.5% | 4.0% |
| Standard Deviation (Sample) | 5.0% | 5.6% |
| Standard Deviation (Population) | 5.0% | 5.5% |
Similar Demographics by 11th Grade
Demographics Similar to Choctaw by 11th Grade
In terms of 11th grade, the demographic groups most similar to Choctaw are Immigrants from Afghanistan (91.8%, a difference of 0.010%), Uruguayan (91.8%, a difference of 0.020%), Cheyenne (91.8%, a difference of 0.030%), Immigrants from Cameroon (91.8%, a difference of 0.040%), and Immigrants from Panama (91.8%, a difference of 0.040%).
| Demographics | Rating | Rank | 11th Grade |
| Costa Ricans | 6.3 /100 | #224 | Tragic 91.9% |
| Immigrants | Zaire | 5.4 /100 | #225 | Tragic 91.9% |
| Immigrants | Somalia | 5.2 /100 | #226 | Tragic 91.9% |
| Immigrants | Cameroon | 4.4 /100 | #227 | Tragic 91.8% |
| Immigrants | Panama | 4.3 /100 | #228 | Tragic 91.8% |
| Nigerians | 4.3 /100 | #229 | Tragic 91.8% |
| Immigrants | Afghanistan | 3.9 /100 | #230 | Tragic 91.8% |
| Choctaw | 3.7 /100 | #231 | Tragic 91.8% |
| Uruguayans | 3.5 /100 | #232 | Tragic 91.8% |
| Cheyenne | 3.3 /100 | #233 | Tragic 91.8% |
| Armenians | 2.9 /100 | #234 | Tragic 91.7% |
| Sub-Saharan Africans | 2.9 /100 | #235 | Tragic 91.7% |
| Colombians | 2.8 /100 | #236 | Tragic 91.7% |
| Immigrants | Bolivia | 2.8 /100 | #237 | Tragic 91.7% |
| Comanche | 2.6 /100 | #238 | Tragic 91.7% |
Demographics Similar to Immigrants from Northern Europe by 11th Grade
In terms of 11th grade, the demographic groups most similar to Immigrants from Northern Europe are Immigrants from Singapore (94.2%, a difference of 0.0%), British (94.2%, a difference of 0.010%), Immigrants from Scotland (94.2%, a difference of 0.010%), Northern European (94.2%, a difference of 0.010%), and Hungarian (94.2%, a difference of 0.010%).
| Demographics | Rating | Rank | 11th Grade |
| Dutch | 100.0 /100 | #29 | Exceptional 94.3% |
| Russians | 100.0 /100 | #30 | Exceptional 94.3% |
| Welsh | 99.9 /100 | #31 | Exceptional 94.2% |
| Belgians | 99.9 /100 | #32 | Exceptional 94.2% |
| British | 99.9 /100 | #33 | Exceptional 94.2% |
| Immigrants | Scotland | 99.9 /100 | #34 | Exceptional 94.2% |
| Immigrants | Singapore | 99.9 /100 | #35 | Exceptional 94.2% |
| Immigrants | Northern Europe | 99.9 /100 | #36 | Exceptional 94.2% |
| Northern Europeans | 99.9 /100 | #37 | Exceptional 94.2% |
| Hungarians | 99.9 /100 | #38 | Exceptional 94.2% |
| Immigrants | Lithuania | 99.9 /100 | #39 | Exceptional 94.1% |
| Thais | 99.9 /100 | #40 | Exceptional 94.1% |
| Cypriots | 99.9 /100 | #41 | Exceptional 94.1% |
| Immigrants | Austria | 99.9 /100 | #42 | Exceptional 94.1% |
| Greeks | 99.9 /100 | #43 | Exceptional 94.1% |