Choctaw vs French Canadian 8th Grade
COMPARE
Choctaw
French Canadian
8th Grade
8th Grade Comparison
Choctaw
French Canadians
96.2%
8TH GRADE
94.0/ 100
METRIC RATING
126th/ 347
METRIC RANK
97.2%
8TH GRADE
100.0/ 100
METRIC RATING
23rd/ 347
METRIC RANK
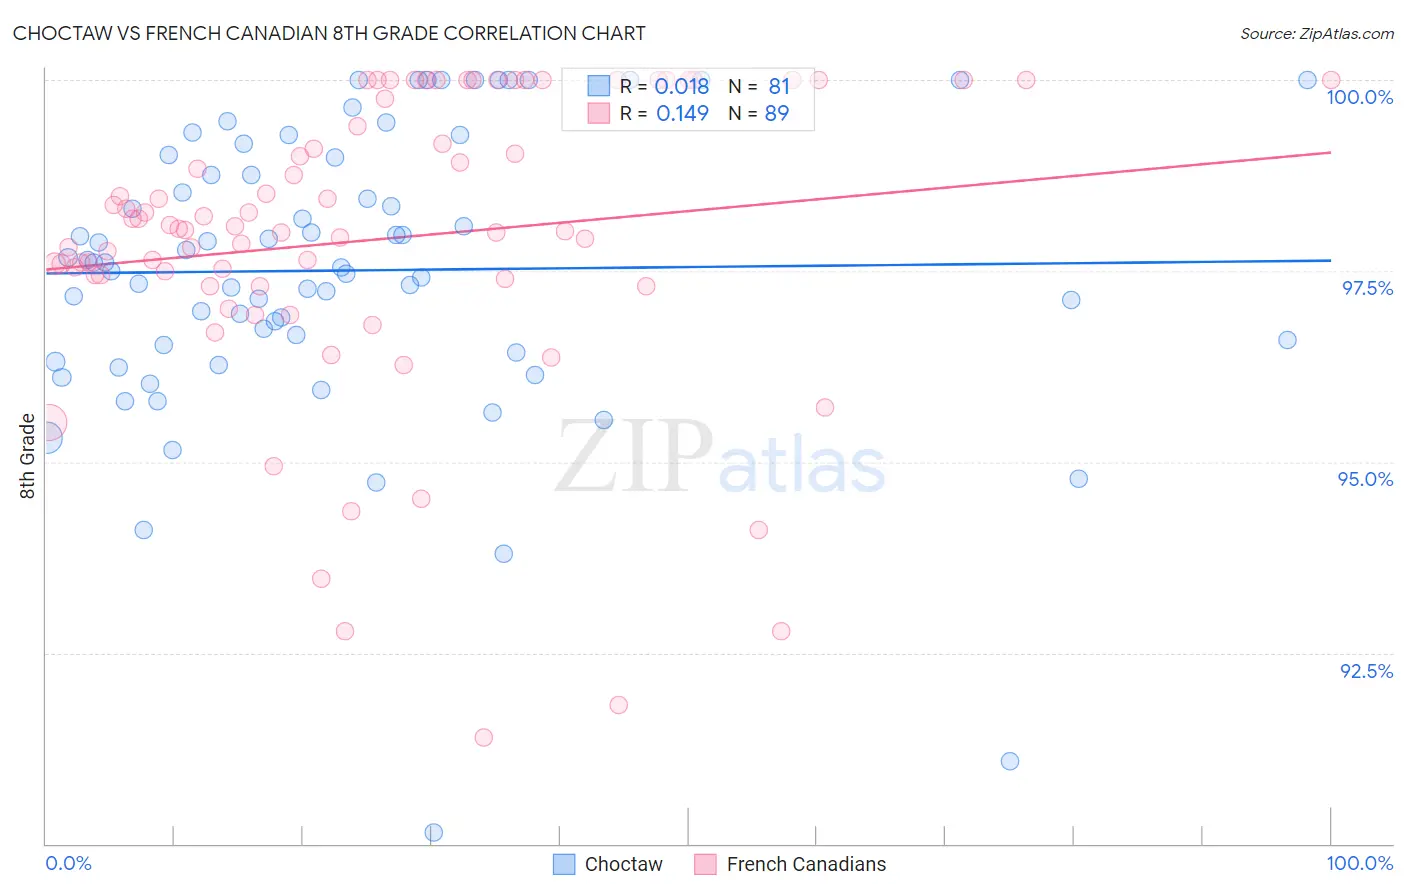
Choctaw vs French Canadian 8th Grade Correlation Chart
The statistical analysis conducted on geographies consisting of 269,742,875 people shows no correlation between the proportion of Choctaw and percentage of population with at least 8th grade education in the United States with a correlation coefficient (R) of 0.018 and weighted average of 96.2%. Similarly, the statistical analysis conducted on geographies consisting of 502,678,839 people shows a poor positive correlation between the proportion of French Canadians and percentage of population with at least 8th grade education in the United States with a correlation coefficient (R) of 0.149 and weighted average of 97.2%, a difference of 1.0%.
8th Grade Correlation Summary
| Measurement | Choctaw | French Canadian |
| Minimum | 90.2% | 91.4% |
| Maximum | 100.0% | 100.0% |
| Range | 9.8% | 8.6% |
| Mean | 97.5% | 97.9% |
| Median | 97.6% | 98.1% |
| Interquartile 25% (IQ1) | 96.5% | 97.3% |
| Interquartile 75% (IQ3) | 99.0% | 99.9% |
| Interquartile Range (IQR) | 2.5% | 2.5% |
| Standard Deviation (Sample) | 1.9% | 2.0% |
| Standard Deviation (Population) | 1.9% | 1.9% |
Similar Demographics by 8th Grade
Demographics Similar to Choctaw by 8th Grade
In terms of 8th grade, the demographic groups most similar to Choctaw are Immigrants from Romania (96.2%, a difference of 0.0%), Immigrants from Serbia (96.2%, a difference of 0.0%), Immigrants from Bosnia and Herzegovina (96.2%, a difference of 0.0%), Filipino (96.2%, a difference of 0.020%), and Palestinian (96.2%, a difference of 0.020%).
| Demographics | Rating | Rank | 8th Grade |
| Immigrants | Switzerland | 95.3 /100 | #119 | Exceptional 96.2% |
| Immigrants | France | 95.3 /100 | #120 | Exceptional 96.2% |
| Immigrants | Bulgaria | 95.3 /100 | #121 | Exceptional 96.2% |
| Immigrants | Europe | 95.3 /100 | #122 | Exceptional 96.2% |
| Filipinos | 94.6 /100 | #123 | Exceptional 96.2% |
| Palestinians | 94.6 /100 | #124 | Exceptional 96.2% |
| Immigrants | Romania | 94.1 /100 | #125 | Exceptional 96.2% |
| Choctaw | 94.0 /100 | #126 | Exceptional 96.2% |
| Immigrants | Serbia | 94.0 /100 | #127 | Exceptional 96.2% |
| Immigrants | Bosnia and Herzegovina | 93.9 /100 | #128 | Exceptional 96.2% |
| Cheyenne | 93.3 /100 | #129 | Exceptional 96.1% |
| Soviet Union | 92.6 /100 | #130 | Exceptional 96.1% |
| Pueblo | 92.3 /100 | #131 | Exceptional 96.1% |
| Immigrants | Kuwait | 92.2 /100 | #132 | Exceptional 96.1% |
| Immigrants | Turkey | 91.7 /100 | #133 | Exceptional 96.1% |
Demographics Similar to French Canadians by 8th Grade
In terms of 8th grade, the demographic groups most similar to French Canadians are Welsh (97.2%, a difference of 0.010%), Scandinavian (97.2%, a difference of 0.010%), Czech (97.1%, a difference of 0.020%), French (97.1%, a difference of 0.020%), and Danish (97.2%, a difference of 0.030%).
| Demographics | Rating | Rank | 8th Grade |
| Tlingit-Haida | 100.0 /100 | #16 | Exceptional 97.3% |
| Irish | 100.0 /100 | #17 | Exceptional 97.3% |
| Lithuanians | 100.0 /100 | #18 | Exceptional 97.3% |
| Scottish | 100.0 /100 | #19 | Exceptional 97.3% |
| Croatians | 100.0 /100 | #20 | Exceptional 97.2% |
| Danes | 100.0 /100 | #21 | Exceptional 97.2% |
| Welsh | 100.0 /100 | #22 | Exceptional 97.2% |
| French Canadians | 100.0 /100 | #23 | Exceptional 97.2% |
| Scandinavians | 100.0 /100 | #24 | Exceptional 97.2% |
| Czechs | 100.0 /100 | #25 | Exceptional 97.1% |
| French | 100.0 /100 | #26 | Exceptional 97.1% |
| Scotch-Irish | 100.0 /100 | #27 | Exceptional 97.1% |
| Italians | 100.0 /100 | #28 | Exceptional 97.1% |
| Europeans | 100.0 /100 | #29 | Exceptional 97.1% |
| Sioux | 100.0 /100 | #30 | Exceptional 97.1% |