Chinese vs Slavic Doctorate Degree
COMPARE
Chinese
Slavic
Doctorate Degree
Doctorate Degree Comparison
Chinese
Slavs
1.8%
DOCTORATE DEGREE
25.1/ 100
METRIC RATING
197th/ 347
METRIC RANK
1.9%
DOCTORATE DEGREE
72.4/ 100
METRIC RATING
156th/ 347
METRIC RANK
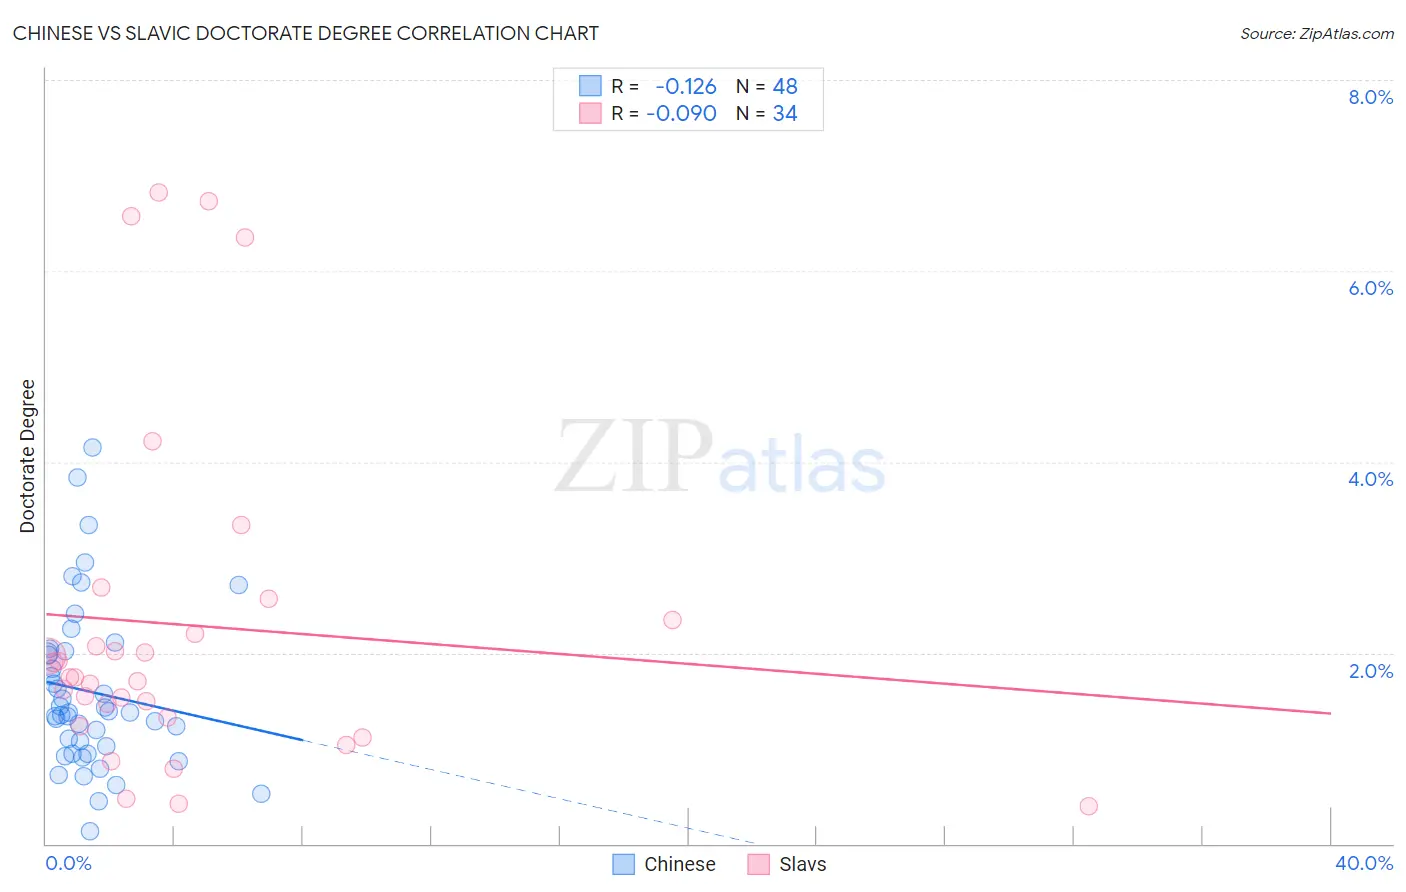
Chinese vs Slavic Doctorate Degree Correlation Chart
The statistical analysis conducted on geographies consisting of 64,665,002 people shows a poor negative correlation between the proportion of Chinese and percentage of population with at least doctorate degree education in the United States with a correlation coefficient (R) of -0.126 and weighted average of 1.8%. Similarly, the statistical analysis conducted on geographies consisting of 269,161,958 people shows a slight negative correlation between the proportion of Slavs and percentage of population with at least doctorate degree education in the United States with a correlation coefficient (R) of -0.090 and weighted average of 1.9%, a difference of 7.9%.
Doctorate Degree Correlation Summary
| Measurement | Chinese | Slavic |
| Minimum | 0.13% | 0.39% |
| Maximum | 4.1% | 6.8% |
| Range | 4.0% | 6.4% |
| Mean | 1.6% | 2.3% |
| Median | 1.4% | 1.7% |
| Interquartile 25% (IQ1) | 0.98% | 1.3% |
| Interquartile 75% (IQ3) | 2.0% | 2.3% |
| Interquartile Range (IQR) | 1.0% | 1.0% |
| Standard Deviation (Sample) | 0.86% | 1.8% |
| Standard Deviation (Population) | 0.85% | 1.8% |
Similar Demographics by Doctorate Degree
Demographics Similar to Chinese by Doctorate Degree
In terms of doctorate degree, the demographic groups most similar to Chinese are Subsaharan African (1.8%, a difference of 0.0%), Immigrants from Somalia (1.8%, a difference of 0.070%), Immigrants from Ghana (1.8%, a difference of 0.080%), Uruguayan (1.8%, a difference of 0.23%), and Immigrants from South America (1.8%, a difference of 0.37%).
| Demographics | Rating | Rank | Doctorate Degree |
| Immigrants | Costa Rica | 30.2 /100 | #190 | Fair 1.8% |
| South Americans | 29.5 /100 | #191 | Fair 1.8% |
| Dutch | 27.4 /100 | #192 | Fair 1.8% |
| German Russians | 27.1 /100 | #193 | Fair 1.8% |
| Uruguayans | 26.2 /100 | #194 | Fair 1.8% |
| Immigrants | Somalia | 25.4 /100 | #195 | Fair 1.8% |
| Sub-Saharan Africans | 25.1 /100 | #196 | Fair 1.8% |
| Chinese | 25.1 /100 | #197 | Fair 1.8% |
| Immigrants | Ghana | 24.6 /100 | #198 | Fair 1.8% |
| Immigrants | South America | 23.3 /100 | #199 | Fair 1.8% |
| Whites/Caucasians | 22.8 /100 | #200 | Fair 1.8% |
| Immigrants | Nigeria | 22.4 /100 | #201 | Fair 1.8% |
| Portuguese | 21.4 /100 | #202 | Fair 1.8% |
| Immigrants | Vietnam | 21.4 /100 | #203 | Fair 1.8% |
| Somalis | 21.2 /100 | #204 | Fair 1.7% |
Demographics Similar to Slavs by Doctorate Degree
In terms of doctorate degree, the demographic groups most similar to Slavs are Polish (1.9%, a difference of 0.060%), Immigrants from Albania (1.9%, a difference of 0.080%), Danish (1.9%, a difference of 0.090%), Hungarian (1.9%, a difference of 0.11%), and Immigrants from Oceania (1.9%, a difference of 0.30%).
| Demographics | Rating | Rank | Doctorate Degree |
| Basques | 76.9 /100 | #149 | Good 1.9% |
| English | 75.9 /100 | #150 | Good 1.9% |
| Albanians | 74.8 /100 | #151 | Good 1.9% |
| Immigrants | Kenya | 74.3 /100 | #152 | Good 1.9% |
| Immigrants | Oceania | 74.0 /100 | #153 | Good 1.9% |
| Immigrants | Albania | 72.8 /100 | #154 | Good 1.9% |
| Poles | 72.7 /100 | #155 | Good 1.9% |
| Slavs | 72.4 /100 | #156 | Good 1.9% |
| Danes | 71.9 /100 | #157 | Good 1.9% |
| Hungarians | 71.7 /100 | #158 | Good 1.9% |
| Slovenes | 70.2 /100 | #159 | Good 1.9% |
| Welsh | 69.7 /100 | #160 | Good 1.9% |
| Immigrants | Middle Africa | 68.8 /100 | #161 | Good 1.9% |
| Irish | 67.5 /100 | #162 | Good 1.9% |
| Czechs | 67.3 /100 | #163 | Good 1.9% |