Chilean vs Immigrants from Iraq Kindergarten

COMPARE

Chilean
Race
Ancestry
AfghanAfricanAlaska NativeAlaskan AthabascanAlbanianAleutAlsatianAmericanApacheArabArapahoArgentineanArmenianAssyrian/Chaldean/SyriacAustralianAustrianBahamianBangladeshiBarbadianBasqueBelgianBelizeanBermudanBhutaneseBlackfeetBolivianBrazilianBritishBritish West IndianBulgarianBurmeseCajunCambodianCanadianCape VerdeanCarpatho RusynCelticCentral AmericanCentral American IndianCherokeeCheyenneChickasawChileanChineseChippewaChoctawColombianColvilleComancheCosta RicanCreeCreekCroatianCrowCubanCypriotCzechCzechoslovakianDanishDelawareDominicanDutchDutch West IndianEastern EuropeanEcuadorianEgyptianEnglishEstonianEthiopianEuropeanFijianFilipinoFinnishFrenchFrench American IndianFrench CanadianGermanGerman RussianGhanaianGreekGuamanian/ChamorroGuatemalanGuyaneseHaitianHmongHonduranHopiHoumaHungarianIcelanderIndian (Asian)IndonesianInupiatIranianIraqiIrishIroquoisIsraeliItalianJamaicanJapaneseJordanianKenyanKiowaKoreanLaotianLatvianLebaneseLiberianLithuanianLumbeeLuxembourgerMacedonianMalaysianMalteseMarshalleseMenomineeMexicanMexican American IndianMongolianMoroccanNative HawaiianNavajoNepaleseNew ZealanderNicaraguanNigerianNorthern EuropeanNorwegianOkinawanOsageOttawaPaiutePakistaniPalestinianPanamanianParaguayanPennsylvania GermanPeruvianPimaPolishPortuguesePotawatomiPuebloPuerto RicanPuget Sound SalishRomanianRussianSalvadoranSamoanScandinavianScotch-IrishScottishSeminoleSenegaleseSerbianShoshoneSierra LeoneanSiouxSlavicSlovakSloveneSomaliSouth AfricanSouth AmericanSouth American IndianSoviet UnionSpaniardSpanishSpanish AmericanSpanish American IndianSri LankanSubsaharan AfricanSudaneseSwedishSwissSyrianTaiwaneseThaiTlingit-HaidaTohono O'OdhamTonganTrinidadian and TobagonianTsimshianTurkishU.S. Virgin IslanderUgandanUkrainianUruguayanUteVenezuelanVietnameseWelshWest IndianYakamaYaquiYugoslavianYumanYup'ikZimbabwean
Immigration
NonimmigrantsImmigrantsAfghanistanAfricaAlbaniaArgentinaArmeniaAsiaAustraliaAustriaBahamasBangladeshBarbadosBelarusBelgiumBelizeBoliviaBosnia and HerzegovinaBrazilBulgariaBurma/MyanmarCabo VerdeCambodiaCameroonCanadaCaribbeanCentral AmericaChileChinaColombiaCongoCosta RicaCroatiaCubaCzechoslovakiaDenmarkDominicaDominican RepublicEastern AfricaEastern AsiaEastern EuropeEcuadorEgyptEl SalvadorEnglandEritreaEthiopiaEuropeFijiFranceGermanyGhanaGreeceGrenadaGuatemalaGuyanaHaitiHondurasHong KongHungaryIndiaIndonesiaIranIrelandIsraelItalyJamaicaJapanJordanKazakhstanKenyaKoreaKuwaitLaosLatin AmericaLatviaLebanonLiberiaLithuaniaMalaysiaMexicoMicronesiaMiddle AfricaMoldovaMoroccoNepalNetherlandsNicaraguaNigeriaNorth AmericaNorth MacedoniaNorthern AfricaNorthern EuropeNorwayOceaniaPakistanPanamaPeruPhilippinesPolandPortugalRomaniaRussiaSaudi ArabiaScotlandSenegalSerbiaSierra LeoneSingaporeSomaliaSouth AfricaSouth AmericaSouth Central AsiaSouth Eastern AsiaSouthern EuropeSpainSri LankaSt. Vincent and the GrenadinesSudanSwedenSwitzerlandSyriaTaiwanThailandTrinidad and TobagoTurkeyUgandaUkraineUruguayUzbekistanVenezuelaVietnamWest IndiesWestern AfricaWestern AsiaWestern EuropeYemenZaireZimbabweAzores
Immigrants from Iraq
Race
Ancestry
AfghanAfricanAlaska NativeAlaskan AthabascanAlbanianAleutAlsatianAmericanApacheArabArapahoArgentineanArmenianAssyrian/Chaldean/SyriacAustralianAustrianBahamianBangladeshiBarbadianBasqueBelgianBelizeanBermudanBhutaneseBlackfeetBolivianBrazilianBritishBritish West IndianBulgarianBurmeseCajunCambodianCanadianCape VerdeanCarpatho RusynCelticCentral AmericanCentral American IndianCherokeeCheyenneChickasawChineseChippewaChoctawColombianColvilleComancheCosta RicanCreeCreekCroatianCrowCubanCypriotCzechCzechoslovakianDanishDelawareDominicanDutchDutch West IndianEastern EuropeanEcuadorianEgyptianEnglishEstonianEthiopianEuropeanFijianFilipinoFinnishFrenchFrench American IndianFrench CanadianGermanGerman RussianGhanaianGreekGuamanian/ChamorroGuatemalanGuyaneseHaitianHmongHonduranHopiHoumaHungarianIcelanderIndian (Asian)IndonesianInupiatIranianIraqiIrishIroquoisIsraeliItalianJamaicanJapaneseJordanianKenyanKiowaKoreanLaotianLatvianLebaneseLiberianLithuanianLumbeeLuxembourgerMacedonianMalaysianMalteseMarshalleseMenomineeMexicanMexican American IndianMongolianMoroccanNative HawaiianNavajoNepaleseNew ZealanderNicaraguanNigerianNorthern EuropeanNorwegianOkinawanOsageOttawaPaiutePakistaniPalestinianPanamanianParaguayanPennsylvania GermanPeruvianPimaPolishPortuguesePotawatomiPuebloPuerto RicanPuget Sound SalishRomanianRussianSalvadoranSamoanScandinavianScotch-IrishScottishSeminoleSenegaleseSerbianShoshoneSierra LeoneanSiouxSlavicSlovakSloveneSomaliSouth AfricanSouth AmericanSouth American IndianSoviet UnionSpaniardSpanishSpanish AmericanSpanish American IndianSri LankanSubsaharan AfricanSudaneseSwedishSwissSyrianTaiwaneseThaiTlingit-HaidaTohono O'OdhamTonganTrinidadian and TobagonianTsimshianTurkishU.S. Virgin IslanderUgandanUkrainianUruguayanUteVenezuelanVietnameseWelshWest IndianYakamaYaquiYugoslavianYumanYup'ikZimbabwean
Immigration
NonimmigrantsImmigrantsAfghanistanAfricaAlbaniaArgentinaArmeniaAsiaAustraliaAustriaBahamasBangladeshBarbadosBelarusBelgiumBelizeBoliviaBosnia and HerzegovinaBrazilBulgariaBurma/MyanmarCabo VerdeCambodiaCameroonCanadaCaribbeanCentral AmericaChileChinaColombiaCongoCosta RicaCroatiaCubaCzechoslovakiaDenmarkDominicaDominican RepublicEastern AfricaEastern AsiaEastern EuropeEcuadorEgyptEl SalvadorEnglandEritreaEthiopiaEuropeFijiFranceGermanyGhanaGreeceGrenadaGuatemalaGuyanaHaitiHondurasHong KongHungaryIndiaIndonesiaIranIraqIrelandIsraelItalyJamaicaJapanJordanKazakhstanKenyaKoreaKuwaitLaosLatin AmericaLatviaLebanonLiberiaLithuaniaMalaysiaMexicoMicronesiaMiddle AfricaMoldovaMoroccoNepalNetherlandsNicaraguaNigeriaNorth AmericaNorth MacedoniaNorthern AfricaNorthern EuropeNorwayOceaniaPakistanPanamaPeruPhilippinesPolandPortugalRomaniaRussiaSaudi ArabiaScotlandSenegalSerbiaSierra LeoneSingaporeSomaliaSouth AfricaSouth AmericaSouth Central AsiaSouth Eastern AsiaSouthern EuropeSpainSri LankaSt. Vincent and the GrenadinesSudanSwedenSwitzerlandSyriaTaiwanThailandTrinidad and TobagoTurkeyUgandaUkraineUruguayUzbekistanVenezuelaVietnamWest IndiesWestern AfricaWestern AsiaWestern EuropeYemenZaireZimbabweAzores
Kindergarten
Income
Poverty
Unemployment
Labor Participation
Family Structure
Vehicle Availability
Education Level
Disability

Kindergarten Comparison

Chileans

Immigrants from Iraq

Average
Tragic
98.0%
KINDERGARTEN
56.3/ 100
METRIC RATING
166th/ 347
METRIC RANK
97.6%
KINDERGARTEN
0.9/ 100
METRIC RATING
252nd/ 347
METRIC RANK

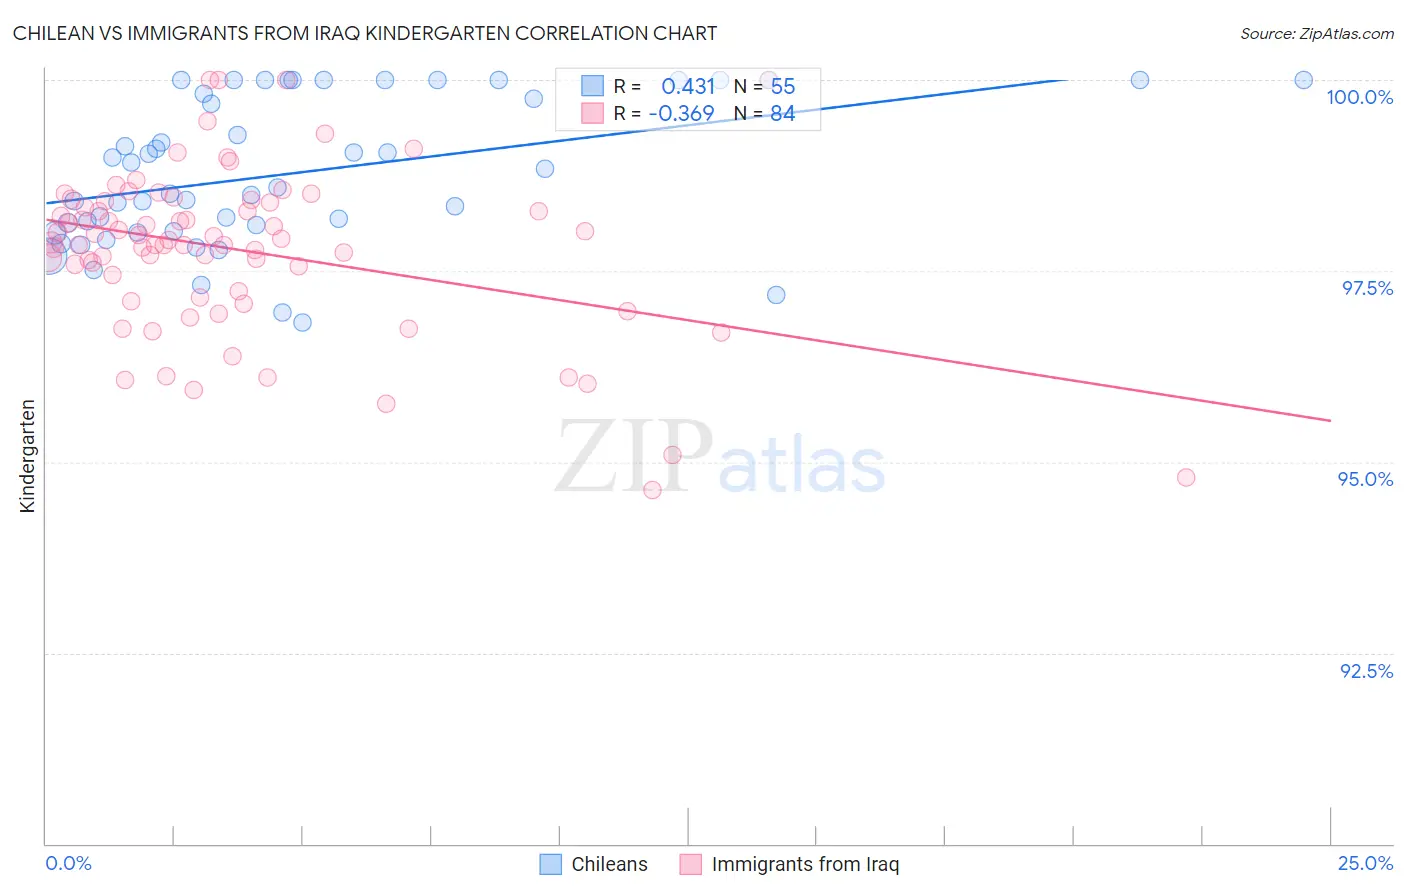
Chilean vs Immigrants from Iraq Kindergarten Correlation Chart

The statistical analysis conducted on geographies consisting of 256,684,337 people shows a moderate positive correlation between the proportion of Chileans and percentage of population with at least kindergarten education in the United States with a correlation coefficient (R) of 0.431 and weighted average of 98.0%. Similarly, the statistical analysis conducted on geographies consisting of 194,726,982 people shows a mild negative correlation between the proportion of Immigrants from Iraq and percentage of population with at least kindergarten education in the United States with a correlation coefficient (R) of -0.369 and weighted average of 97.6%, a difference of 0.39%.
Chilean vs Immigrants from Iraq Kindergarten

Kindergarten Correlation Summary

MeasurementChileanImmigrants from Iraq
Minimum96.8%94.6%
Maximum100.0%100.0%
Range3.2%5.4%
Mean98.8%97.8%
Median98.6%97.9%
Interquartile 25% (IQ1)98.0%97.2%
Interquartile 75% (IQ3)100.0%98.4%
Interquartile Range (IQR)2.0%1.2%
Standard Deviation (Sample)0.95%1.1%
Standard Deviation (Population)0.94%1.1%

Similar Demographics by Kindergarten

Demographics Similar to Chileans by Kindergarten

In terms of kindergarten, the demographic groups most similar to Chileans are Spanish American (98.0%, a difference of 0.0%), Immigrants from Micronesia (98.0%, a difference of 0.0%), Ugandan (98.0%, a difference of 0.0%), Immigrants from Russia (98.0%, a difference of 0.010%), and Immigrants from Eastern Europe (98.0%, a difference of 0.010%).
DemographicsRating | RankKindergarten
French American Indians
63.7
/100
|
#159
Good
98.0%
Immigrants | Russia
59.0
/100
|
#160
Average
98.0%
Immigrants | Eastern Europe
59.0
/100
|
#161
Average
98.0%
Immigrants | Italy
58.9
/100
|
#162
Average
98.0%
Spanish Americans
57.8
/100
|
#163
Average
98.0%
Immigrants | Micronesia
57.7
/100
|
#164
Average
98.0%
Ugandans
56.9
/100
|
#165
Average
98.0%
Chileans
56.3
/100
|
#166
Average
98.0%
Immigrants | Spain
54.6
/100
|
#167
Average
98.0%
Navajo
54.4
/100
|
#168
Average
98.0%
Immigrants | Korea
54.1
/100
|
#169
Average
98.0%
Bermudans
54.0
/100
|
#170
Average
98.0%
Immigrants | Jordan
54.0
/100
|
#171
Average
98.0%
Natives/Alaskans
51.0
/100
|
#172
Average
98.0%
Kenyans
51.0
/100
|
#173
Average
98.0%

Demographics Similar to Immigrants from Iraq by Kindergarten

In terms of kindergarten, the demographic groups most similar to Immigrants from Iraq are Ethiopian (97.6%, a difference of 0.0%), Immigrants from Africa (97.6%, a difference of 0.0%), Indian (Asian) (97.6%, a difference of 0.010%), Immigrants from Eastern Africa (97.6%, a difference of 0.010%), and Immigrants from Middle Africa (97.6%, a difference of 0.010%).
DemographicsRating | RankKindergarten
South Americans
1.1
/100
|
#245
Tragic
97.6%
Indians (Asian)
1.0
/100
|
#246
Tragic
97.6%
Immigrants | Eastern Africa
1.0
/100
|
#247
Tragic
97.6%
Immigrants | Middle Africa
1.0
/100
|
#248
Tragic
97.6%
Peruvians
1.0
/100
|
#249
Tragic
97.6%
Immigrants | Senegal
0.9
/100
|
#250
Tragic
97.6%
Ethiopians
0.9
/100
|
#251
Tragic
97.6%
Immigrants | Iraq
0.9
/100
|
#252
Tragic
97.6%
Immigrants | Africa
0.8
/100
|
#253
Tragic
97.6%
Immigrants | Asia
0.8
/100
|
#254
Tragic
97.6%
Immigrants | Congo
0.8
/100
|
#255
Tragic
97.6%
Yaqui
0.7
/100
|
#256
Tragic
97.6%
Immigrants | Colombia
0.6
/100
|
#257
Tragic
97.6%
Jamaicans
0.6
/100
|
#258
Tragic
97.6%
Armenians
0.5
/100
|
#259
Tragic
97.6%