Chickasaw vs Immigrants from Costa Rica Kindergarten
COMPARE
Chickasaw
Immigrants from Costa Rica
Kindergarten
Kindergarten Comparison
Chickasaw
Immigrants from Costa Rica
98.4%
KINDERGARTEN
99.6/ 100
METRIC RATING
71st/ 347
METRIC RANK
97.7%
KINDERGARTEN
3.6/ 100
METRIC RATING
227th/ 347
METRIC RANK
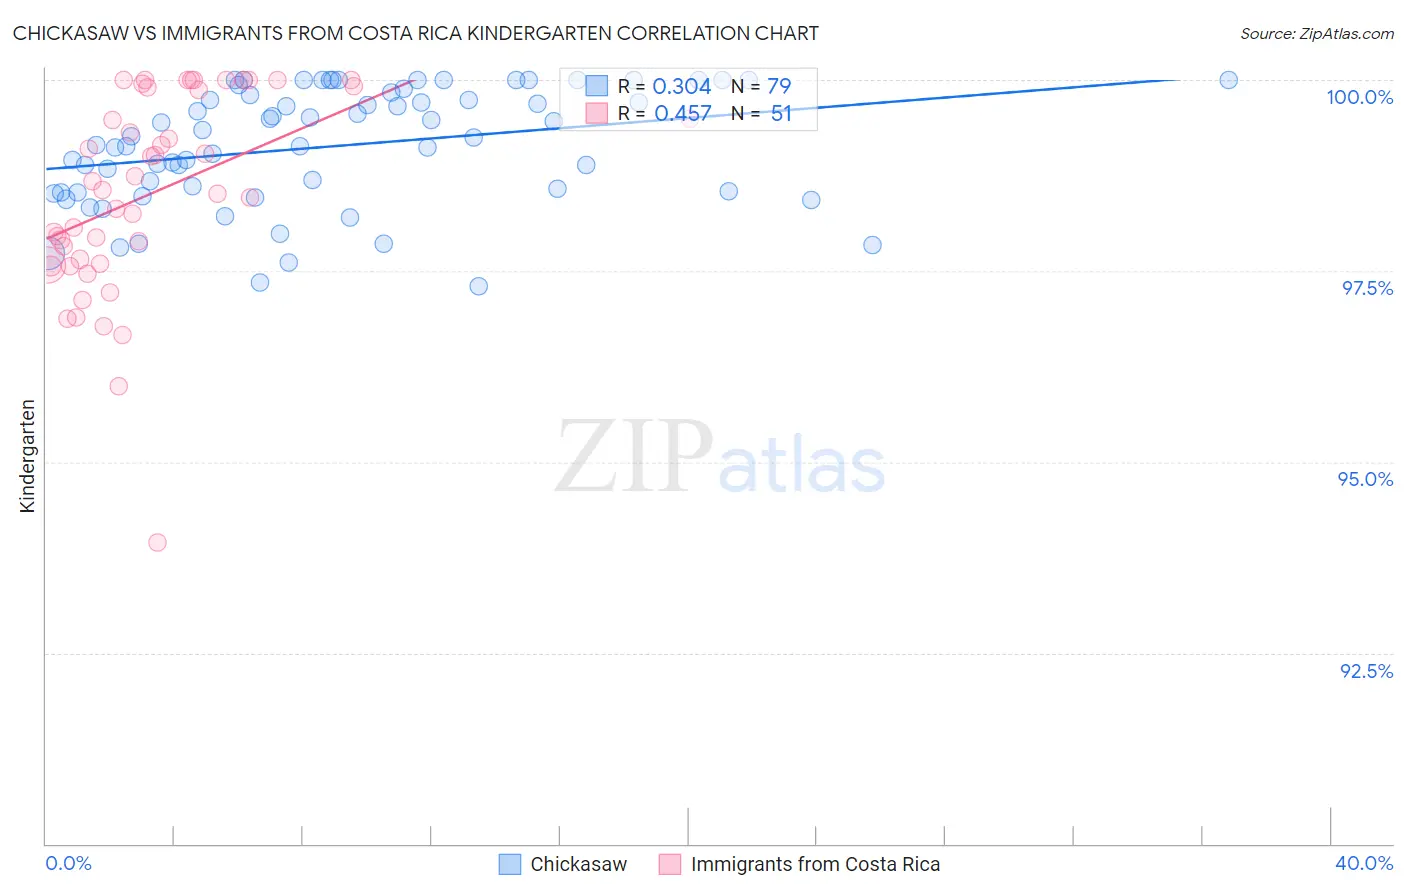
Chickasaw vs Immigrants from Costa Rica Kindergarten Correlation Chart
The statistical analysis conducted on geographies consisting of 147,725,081 people shows a mild positive correlation between the proportion of Chickasaw and percentage of population with at least kindergarten education in the United States with a correlation coefficient (R) of 0.304 and weighted average of 98.4%. Similarly, the statistical analysis conducted on geographies consisting of 204,275,869 people shows a moderate positive correlation between the proportion of Immigrants from Costa Rica and percentage of population with at least kindergarten education in the United States with a correlation coefficient (R) of 0.457 and weighted average of 97.7%, a difference of 0.68%.
Kindergarten Correlation Summary
| Measurement | Chickasaw | Immigrants from Costa Rica |
| Minimum | 97.3% | 93.9% |
| Maximum | 100.0% | 100.0% |
| Range | 2.7% | 6.1% |
| Mean | 99.1% | 98.5% |
| Median | 99.3% | 98.6% |
| Interquartile 25% (IQ1) | 98.5% | 97.6% |
| Interquartile 75% (IQ3) | 99.8% | 99.9% |
| Interquartile Range (IQR) | 1.3% | 2.3% |
| Standard Deviation (Sample) | 0.76% | 1.3% |
| Standard Deviation (Population) | 0.76% | 1.3% |
Similar Demographics by Kindergarten
Demographics Similar to Chickasaw by Kindergarten
In terms of kindergarten, the demographic groups most similar to Chickasaw are Immigrants from Northern Europe (98.4%, a difference of 0.0%), Immigrants from Austria (98.4%, a difference of 0.0%), Russian (98.4%, a difference of 0.0%), Serbian (98.4%, a difference of 0.0%), and Cheyenne (98.4%, a difference of 0.010%).
| Demographics | Rating | Rank | Kindergarten |
| Greeks | 99.7 /100 | #64 | Exceptional 98.4% |
| Maltese | 99.7 /100 | #65 | Exceptional 98.4% |
| Cheyenne | 99.6 /100 | #66 | Exceptional 98.4% |
| Canadians | 99.6 /100 | #67 | Exceptional 98.4% |
| Immigrants | Northern Europe | 99.6 /100 | #68 | Exceptional 98.4% |
| Immigrants | Austria | 99.6 /100 | #69 | Exceptional 98.4% |
| Russians | 99.6 /100 | #70 | Exceptional 98.4% |
| Chickasaw | 99.6 /100 | #71 | Exceptional 98.4% |
| Serbians | 99.6 /100 | #72 | Exceptional 98.4% |
| Cajuns | 99.4 /100 | #73 | Exceptional 98.3% |
| Immigrants | Netherlands | 99.3 /100 | #74 | Exceptional 98.3% |
| Cherokee | 99.3 /100 | #75 | Exceptional 98.3% |
| Immigrants | England | 99.3 /100 | #76 | Exceptional 98.3% |
| Delaware | 99.3 /100 | #77 | Exceptional 98.3% |
| Shoshone | 99.2 /100 | #78 | Exceptional 98.3% |
Demographics Similar to Immigrants from Costa Rica by Kindergarten
In terms of kindergarten, the demographic groups most similar to Immigrants from Costa Rica are Sudanese (97.7%, a difference of 0.0%), Subsaharan African (97.7%, a difference of 0.0%), Immigrants from Syria (97.7%, a difference of 0.010%), Iraqi (97.7%, a difference of 0.010%), and Immigrants from Nepal (97.7%, a difference of 0.010%).
| Demographics | Rating | Rank | Kindergarten |
| Tongans | 4.8 /100 | #220 | Tragic 97.7% |
| Immigrants | Zaire | 4.5 /100 | #221 | Tragic 97.7% |
| Immigrants | Sudan | 4.5 /100 | #222 | Tragic 97.7% |
| Immigrants | Syria | 4.3 /100 | #223 | Tragic 97.7% |
| Iraqis | 3.9 /100 | #224 | Tragic 97.7% |
| Immigrants | Nepal | 3.8 /100 | #225 | Tragic 97.7% |
| Sudanese | 3.7 /100 | #226 | Tragic 97.7% |
| Immigrants | Costa Rica | 3.6 /100 | #227 | Tragic 97.7% |
| Sub-Saharan Africans | 3.5 /100 | #228 | Tragic 97.7% |
| Sierra Leoneans | 3.4 /100 | #229 | Tragic 97.7% |
| Senegalese | 3.3 /100 | #230 | Tragic 97.7% |
| Puerto Ricans | 2.7 /100 | #231 | Tragic 97.7% |
| Immigrants | Uruguay | 2.6 /100 | #232 | Tragic 97.7% |
| Immigrants | Pakistan | 2.2 /100 | #233 | Tragic 97.7% |
| Immigrants | Malaysia | 2.2 /100 | #234 | Tragic 97.7% |