Cheyenne vs Slovene 12th Grade, No Diploma

COMPARE

Cheyenne
Race
Ancestry
AfghanAfricanAlaska NativeAlaskan AthabascanAlbanianAleutAlsatianAmericanApacheArabArapahoArgentineanArmenianAssyrian/Chaldean/SyriacAustralianAustrianBahamianBangladeshiBarbadianBasqueBelgianBelizeanBermudanBhutaneseBlackfeetBolivianBrazilianBritishBritish West IndianBulgarianBurmeseCajunCambodianCanadianCape VerdeanCarpatho RusynCelticCentral AmericanCentral American IndianCherokeeCheyenneChickasawChileanChineseChippewaChoctawColombianColvilleComancheCosta RicanCreeCreekCroatianCrowCubanCypriotCzechCzechoslovakianDanishDelawareDominicanDutchDutch West IndianEastern EuropeanEcuadorianEgyptianEnglishEstonianEthiopianEuropeanFijianFilipinoFinnishFrenchFrench American IndianFrench CanadianGermanGerman RussianGhanaianGreekGuamanian/ChamorroGuatemalanGuyaneseHaitianHmongHonduranHopiHoumaHungarianIcelanderIndian (Asian)IndonesianInupiatIranianIraqiIrishIroquoisIsraeliItalianJamaicanJapaneseJordanianKenyanKiowaKoreanLaotianLatvianLebaneseLiberianLithuanianLumbeeLuxembourgerMacedonianMalaysianMalteseMarshalleseMenomineeMexicanMexican American IndianMongolianMoroccanNative HawaiianNavajoNepaleseNew ZealanderNicaraguanNigerianNorthern EuropeanNorwegianOkinawanOsageOttawaPaiutePakistaniPalestinianPanamanianParaguayanPennsylvania GermanPeruvianPimaPolishPortuguesePotawatomiPuebloPuerto RicanPuget Sound SalishRomanianRussianSalvadoranSamoanScandinavianScotch-IrishScottishSeminoleSenegaleseSerbianShoshoneSierra LeoneanSiouxSlavicSlovakSomaliSouth AfricanSouth AmericanSouth American IndianSoviet UnionSpaniardSpanishSpanish AmericanSpanish American IndianSri LankanSubsaharan AfricanSudaneseSwedishSwissSyrianTaiwaneseThaiTlingit-HaidaTohono O'OdhamTonganTrinidadian and TobagonianTsimshianTurkishU.S. Virgin IslanderUgandanUkrainianUruguayanUteVenezuelanVietnameseWelshWest IndianYakamaYaquiYugoslavianYumanYup'ikZimbabwean
Immigration
NonimmigrantsImmigrantsAfghanistanAfricaAlbaniaArgentinaArmeniaAsiaAustraliaAustriaBahamasBangladeshBarbadosBelarusBelgiumBelizeBoliviaBosnia and HerzegovinaBrazilBulgariaBurma/MyanmarCabo VerdeCambodiaCameroonCanadaCaribbeanCentral AmericaChileChinaColombiaCongoCosta RicaCroatiaCubaCzechoslovakiaDenmarkDominicaDominican RepublicEastern AfricaEastern AsiaEastern EuropeEcuadorEgyptEl SalvadorEnglandEritreaEthiopiaEuropeFijiFranceGermanyGhanaGreeceGrenadaGuatemalaGuyanaHaitiHondurasHong KongHungaryIndiaIndonesiaIranIraqIrelandIsraelItalyJamaicaJapanJordanKazakhstanKenyaKoreaKuwaitLaosLatin AmericaLatviaLebanonLiberiaLithuaniaMalaysiaMexicoMicronesiaMiddle AfricaMoldovaMoroccoNepalNetherlandsNicaraguaNigeriaNorth AmericaNorth MacedoniaNorthern AfricaNorthern EuropeNorwayOceaniaPakistanPanamaPeruPhilippinesPolandPortugalRomaniaRussiaSaudi ArabiaScotlandSenegalSerbiaSierra LeoneSingaporeSomaliaSouth AfricaSouth AmericaSouth Central AsiaSouth Eastern AsiaSouthern EuropeSpainSri LankaSt. Vincent and the GrenadinesSudanSwedenSwitzerlandSyriaTaiwanThailandTrinidad and TobagoTurkeyUgandaUkraineUruguayUzbekistanVenezuelaVietnamWest IndiesWestern AfricaWestern AsiaWestern EuropeYemenZaireZimbabweAzores
Slovene
Race
Ancestry
AfghanAfricanAlaska NativeAlaskan AthabascanAlbanianAleutAlsatianAmericanApacheArabArapahoArgentineanArmenianAssyrian/Chaldean/SyriacAustralianAustrianBahamianBangladeshiBarbadianBasqueBelgianBelizeanBermudanBhutaneseBlackfeetBolivianBrazilianBritishBritish West IndianBulgarianBurmeseCajunCambodianCanadianCape VerdeanCarpatho RusynCelticCentral AmericanCentral American IndianCherokeeChickasawChileanChineseChippewaChoctawColombianColvilleComancheCosta RicanCreeCreekCroatianCrowCubanCypriotCzechCzechoslovakianDanishDelawareDominicanDutchDutch West IndianEastern EuropeanEcuadorianEgyptianEnglishEstonianEthiopianEuropeanFijianFilipinoFinnishFrenchFrench American IndianFrench CanadianGermanGerman RussianGhanaianGreekGuamanian/ChamorroGuatemalanGuyaneseHaitianHmongHonduranHopiHoumaHungarianIcelanderIndian (Asian)IndonesianInupiatIranianIraqiIrishIroquoisIsraeliItalianJamaicanJapaneseJordanianKenyanKiowaKoreanLaotianLatvianLebaneseLiberianLithuanianLumbeeLuxembourgerMacedonianMalaysianMalteseMarshalleseMenomineeMexicanMexican American IndianMongolianMoroccanNative HawaiianNavajoNepaleseNew ZealanderNicaraguanNigerianNorthern EuropeanNorwegianOkinawanOsageOttawaPaiutePakistaniPalestinianPanamanianParaguayanPennsylvania GermanPeruvianPimaPolishPortuguesePotawatomiPuebloPuerto RicanPuget Sound SalishRomanianRussianSalvadoranSamoanScandinavianScotch-IrishScottishSeminoleSenegaleseSerbianShoshoneSierra LeoneanSiouxSlavicSlovakSloveneSomaliSouth AfricanSouth AmericanSouth American IndianSoviet UnionSpaniardSpanishSpanish AmericanSpanish American IndianSri LankanSubsaharan AfricanSudaneseSwedishSwissSyrianTaiwaneseThaiTlingit-HaidaTohono O'OdhamTonganTrinidadian and TobagonianTsimshianTurkishU.S. Virgin IslanderUgandanUkrainianUruguayanUteVenezuelanVietnameseWelshWest IndianYakamaYaquiYugoslavianYumanYup'ikZimbabwean
Immigration
NonimmigrantsImmigrantsAfghanistanAfricaAlbaniaArgentinaArmeniaAsiaAustraliaAustriaBahamasBangladeshBarbadosBelarusBelgiumBelizeBoliviaBosnia and HerzegovinaBrazilBulgariaBurma/MyanmarCabo VerdeCambodiaCameroonCanadaCaribbeanCentral AmericaChileChinaColombiaCongoCosta RicaCroatiaCubaCzechoslovakiaDenmarkDominicaDominican RepublicEastern AfricaEastern AsiaEastern EuropeEcuadorEgyptEl SalvadorEnglandEritreaEthiopiaEuropeFijiFranceGermanyGhanaGreeceGrenadaGuatemalaGuyanaHaitiHondurasHong KongHungaryIndiaIndonesiaIranIraqIrelandIsraelItalyJamaicaJapanJordanKazakhstanKenyaKoreaKuwaitLaosLatin AmericaLatviaLebanonLiberiaLithuaniaMalaysiaMexicoMicronesiaMiddle AfricaMoldovaMoroccoNepalNetherlandsNicaraguaNigeriaNorth AmericaNorth MacedoniaNorthern AfricaNorthern EuropeNorwayOceaniaPakistanPanamaPeruPhilippinesPolandPortugalRomaniaRussiaSaudi ArabiaScotlandSenegalSerbiaSierra LeoneSingaporeSomaliaSouth AfricaSouth AmericaSouth Central AsiaSouth Eastern AsiaSouthern EuropeSpainSri LankaSt. Vincent and the GrenadinesSudanSwedenSwitzerlandSyriaTaiwanThailandTrinidad and TobagoTurkeyUgandaUkraineUruguayUzbekistanVenezuelaVietnamWest IndiesWestern AfricaWestern AsiaWestern EuropeYemenZaireZimbabweAzores
12th Grade, No Diploma
Income
Poverty
Unemployment
Labor Participation
Family Structure
Vehicle Availability
Education Level
Disability

12th Grade, No Diploma Comparison

Cheyenne

Slovenes

Tragic
Exceptional
89.6%
12TH GRADE, NO DIPLOMA
0.4/ 100
METRIC RATING
261st/ 347
METRIC RANK
93.6%
12TH GRADE, NO DIPLOMA
100.0/ 100
METRIC RATING
4th/ 347
METRIC RANK

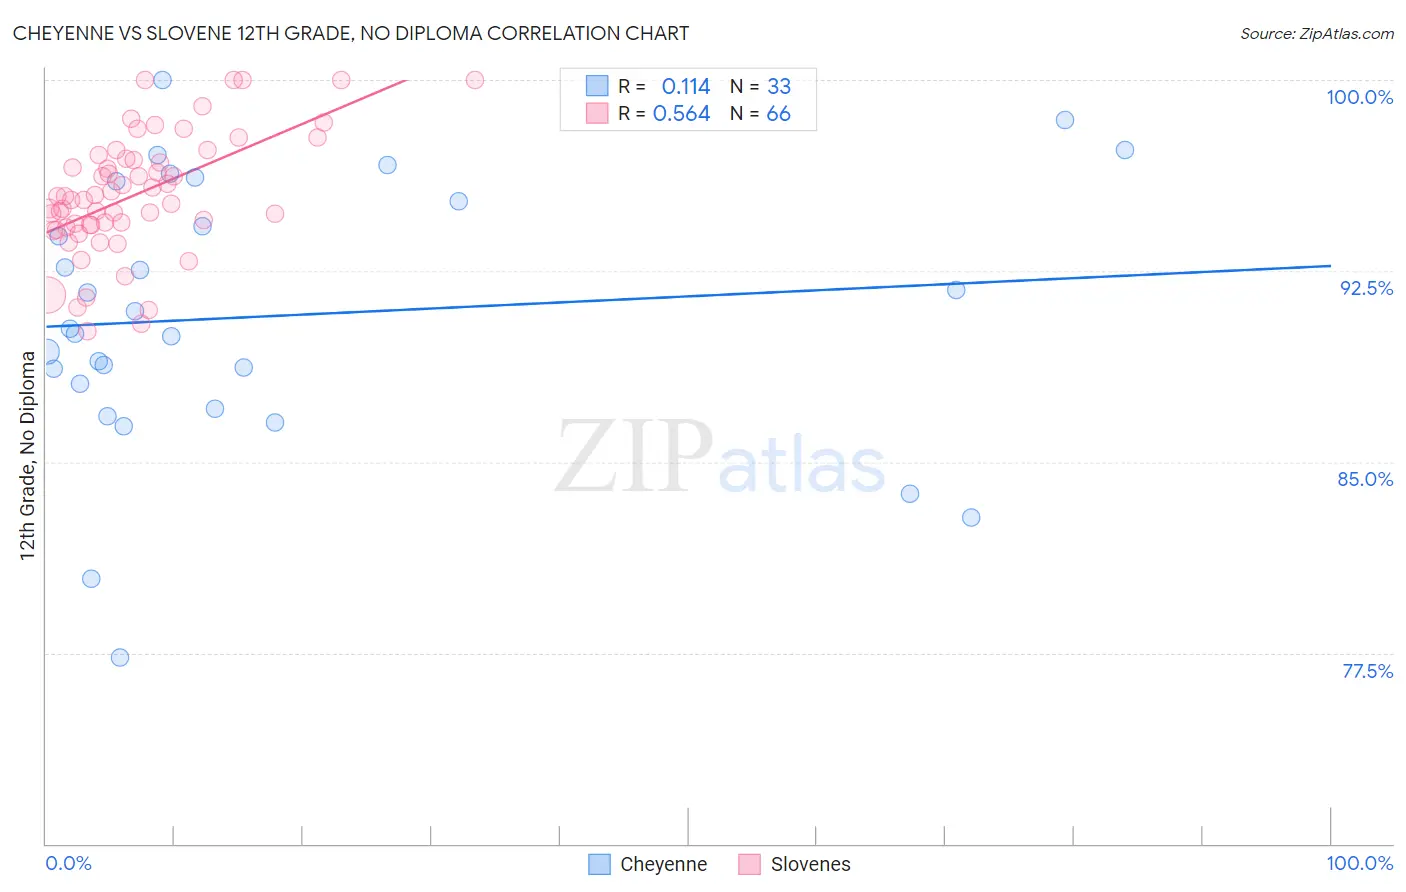
Cheyenne vs Slovene 12th Grade, No Diploma Correlation Chart

The statistical analysis conducted on geographies consisting of 80,719,287 people shows a poor positive correlation between the proportion of Cheyenne and percentage of population with at least 12th grade (no diploma) education in the United States with a correlation coefficient (R) of 0.114 and weighted average of 89.6%. Similarly, the statistical analysis conducted on geographies consisting of 261,353,399 people shows a substantial positive correlation between the proportion of Slovenes and percentage of population with at least 12th grade (no diploma) education in the United States with a correlation coefficient (R) of 0.564 and weighted average of 93.6%, a difference of 4.5%.
Cheyenne vs Slovene 12th Grade, No Diploma

12th Grade, No Diploma Correlation Summary

MeasurementCheyenneSlovene
Minimum77.3%90.1%
Maximum100.0%100.0%
Range22.7%9.9%
Mean90.7%95.5%
Median90.2%95.4%
Interquartile 25% (IQ1)87.6%94.3%
Interquartile 75% (IQ3)95.6%96.9%
Interquartile Range (IQR)8.0%2.6%
Standard Deviation (Sample)5.3%2.4%
Standard Deviation (Population)5.2%2.3%

Similar Demographics by 12th Grade, No Diploma

Demographics Similar to Cheyenne by 12th Grade, No Diploma

In terms of 12th grade, no diploma, the demographic groups most similar to Cheyenne are Sioux (89.6%, a difference of 0.0%), Immigrants from South Eastern Asia (89.6%, a difference of 0.010%), Immigrants from Western Africa (89.6%, a difference of 0.020%), African (89.6%, a difference of 0.040%), and Jamaican (89.7%, a difference of 0.090%).
DemographicsRating | Rank12th Grade, No Diploma
Immigrants | Peru
0.5
/100
|
#254
Tragic
89.7%
Immigrants | Senegal
0.5
/100
|
#255
Tragic
89.7%
Immigrants | Ghana
0.5
/100
|
#256
Tragic
89.7%
Jamaicans
0.5
/100
|
#257
Tragic
89.7%
Africans
0.4
/100
|
#258
Tragic
89.6%
Immigrants | Western Africa
0.4
/100
|
#259
Tragic
89.6%
Immigrants | South Eastern Asia
0.4
/100
|
#260
Tragic
89.6%
Cheyenne
0.4
/100
|
#261
Tragic
89.6%
Sioux
0.4
/100
|
#262
Tragic
89.6%
Immigrants | Jamaica
0.2
/100
|
#263
Tragic
89.5%
Sri Lankans
0.2
/100
|
#264
Tragic
89.4%
Trinidadians and Tobagonians
0.2
/100
|
#265
Tragic
89.4%
Seminole
0.2
/100
|
#266
Tragic
89.4%
West Indians
0.2
/100
|
#267
Tragic
89.3%
Immigrants | Trinidad and Tobago
0.1
/100
|
#268
Tragic
89.3%

Demographics Similar to Slovenes by 12th Grade, No Diploma

In terms of 12th grade, no diploma, the demographic groups most similar to Slovenes are Lithuanian (93.6%, a difference of 0.010%), Carpatho Rusyn (93.6%, a difference of 0.010%), Immigrants from India (93.6%, a difference of 0.020%), Slovak (93.6%, a difference of 0.060%), and Chinese (93.6%, a difference of 0.060%).
DemographicsRating | Rank12th Grade, No Diploma
Norwegians
100.0
/100
|
#1
Exceptional
94.0%
Swedes
100.0
/100
|
#2
Exceptional
93.7%
Lithuanians
100.0
/100
|
#3
Exceptional
93.6%
Slovenes
100.0
/100
|
#4
Exceptional
93.6%
Carpatho Rusyns
100.0
/100
|
#5
Exceptional
93.6%
Immigrants | India
100.0
/100
|
#6
Exceptional
93.6%
Slovaks
100.0
/100
|
#7
Exceptional
93.6%
Chinese
100.0
/100
|
#8
Exceptional
93.6%
Latvians
100.0
/100
|
#9
Exceptional
93.6%
Croatians
100.0
/100
|
#10
Exceptional
93.5%
Poles
100.0
/100
|
#11
Exceptional
93.5%
Eastern Europeans
100.0
/100
|
#12
Exceptional
93.5%
Danes
100.0
/100
|
#13
Exceptional
93.5%
Bulgarians
100.0
/100
|
#14
Exceptional
93.5%
Finns
100.0
/100
|
#15
Exceptional
93.4%