Cherokee vs Immigrants from Cambodia 1st Grade
COMPARE
Cherokee
Immigrants from Cambodia
1st Grade
1st Grade Comparison
Cherokee
Immigrants from Cambodia
98.3%
1ST GRADE
99.3/ 100
METRIC RATING
75th/ 347
METRIC RANK
96.5%
1ST GRADE
0.0/ 100
METRIC RATING
337th/ 347
METRIC RANK
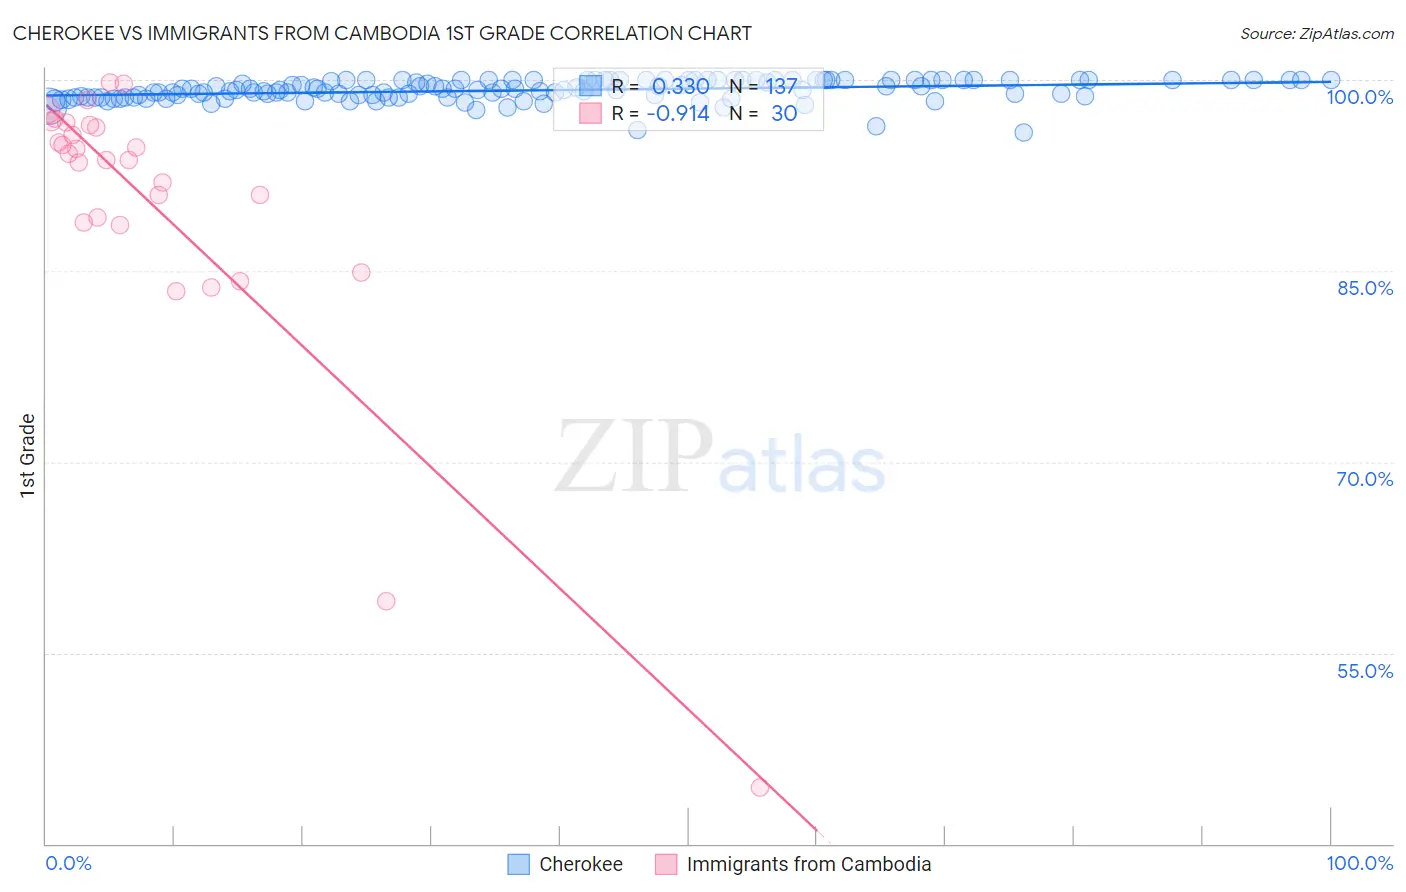
Cherokee vs Immigrants from Cambodia 1st Grade Correlation Chart
The statistical analysis conducted on geographies consisting of 493,719,253 people shows a mild positive correlation between the proportion of Cherokee and percentage of population with at least 1st grade education in the United States with a correlation coefficient (R) of 0.330 and weighted average of 98.3%. Similarly, the statistical analysis conducted on geographies consisting of 205,153,442 people shows a near-perfect negative correlation between the proportion of Immigrants from Cambodia and percentage of population with at least 1st grade education in the United States with a correlation coefficient (R) of -0.914 and weighted average of 96.5%, a difference of 1.9%.
1st Grade Correlation Summary
| Measurement | Cherokee | Immigrants from Cambodia |
| Minimum | 95.9% | 44.4% |
| Maximum | 100.0% | 99.8% |
| Range | 4.1% | 55.4% |
| Mean | 99.2% | 90.3% |
| Median | 99.3% | 94.0% |
| Interquartile 25% (IQ1) | 98.7% | 88.8% |
| Interquartile 75% (IQ3) | 100.0% | 96.5% |
| Interquartile Range (IQR) | 1.3% | 7.7% |
| Standard Deviation (Sample) | 0.80% | 11.6% |
| Standard Deviation (Population) | 0.79% | 11.4% |
Similar Demographics by 1st Grade
Demographics Similar to Cherokee by 1st Grade
In terms of 1st grade, the demographic groups most similar to Cherokee are Immigrants from Netherlands (98.3%, a difference of 0.0%), Shoshone (98.3%, a difference of 0.0%), Immigrants from England (98.3%, a difference of 0.0%), Immigrants from Belgium (98.3%, a difference of 0.010%), and Cajun (98.3%, a difference of 0.020%).
| Demographics | Rating | Rank | 1st Grade |
| Immigrants | Northern Europe | 99.6 /100 | #68 | Exceptional 98.3% |
| Chickasaw | 99.6 /100 | #69 | Exceptional 98.3% |
| Russians | 99.6 /100 | #70 | Exceptional 98.3% |
| Serbians | 99.6 /100 | #71 | Exceptional 98.3% |
| Cheyenne | 99.6 /100 | #72 | Exceptional 98.3% |
| Cajuns | 99.5 /100 | #73 | Exceptional 98.3% |
| Immigrants | Netherlands | 99.4 /100 | #74 | Exceptional 98.3% |
| Cherokee | 99.3 /100 | #75 | Exceptional 98.3% |
| Shoshone | 99.3 /100 | #76 | Exceptional 98.3% |
| Immigrants | England | 99.3 /100 | #77 | Exceptional 98.3% |
| Immigrants | Belgium | 99.2 /100 | #78 | Exceptional 98.3% |
| Immigrants | Lithuania | 99.2 /100 | #79 | Exceptional 98.3% |
| Osage | 99.2 /100 | #80 | Exceptional 98.3% |
| Potawatomi | 99.1 /100 | #81 | Exceptional 98.3% |
| Icelanders | 99.1 /100 | #82 | Exceptional 98.3% |
Demographics Similar to Immigrants from Cambodia by 1st Grade
In terms of 1st grade, the demographic groups most similar to Immigrants from Cambodia are Immigrants from Fiji (96.4%, a difference of 0.020%), Guatemalan (96.5%, a difference of 0.040%), Yakama (96.5%, a difference of 0.060%), Immigrants from Dominican Republic (96.5%, a difference of 0.080%), and Bangladeshi (96.5%, a difference of 0.080%).
| Demographics | Rating | Rank | 1st Grade |
| Immigrants | Vietnam | 0.0 /100 | #330 | Tragic 96.6% |
| Immigrants | Armenia | 0.0 /100 | #331 | Tragic 96.6% |
| Central Americans | 0.0 /100 | #332 | Tragic 96.5% |
| Immigrants | Dominican Republic | 0.0 /100 | #333 | Tragic 96.5% |
| Bangladeshis | 0.0 /100 | #334 | Tragic 96.5% |
| Yakama | 0.0 /100 | #335 | Tragic 96.5% |
| Guatemalans | 0.0 /100 | #336 | Tragic 96.5% |
| Immigrants | Cambodia | 0.0 /100 | #337 | Tragic 96.5% |
| Immigrants | Fiji | 0.0 /100 | #338 | Tragic 96.4% |
| Immigrants | Guatemala | 0.0 /100 | #339 | Tragic 96.4% |
| Immigrants | Cabo Verde | 0.0 /100 | #340 | Tragic 96.3% |
| Immigrants | Central America | 0.0 /100 | #341 | Tragic 96.3% |
| Immigrants | Mexico | 0.0 /100 | #342 | Tragic 96.3% |
| Salvadorans | 0.0 /100 | #343 | Tragic 96.3% |
| Nepalese | 0.0 /100 | #344 | Tragic 96.1% |