Central American vs Black/African American 8th Grade
COMPARE
Central American
Black/African American
8th Grade
8th Grade Comparison
Central Americans
Blacks/African Americans
91.6%
8TH GRADE
0.0/ 100
METRIC RATING
338th/ 347
METRIC RANK
95.6%
8TH GRADE
34.8/ 100
METRIC RATING
185th/ 347
METRIC RANK
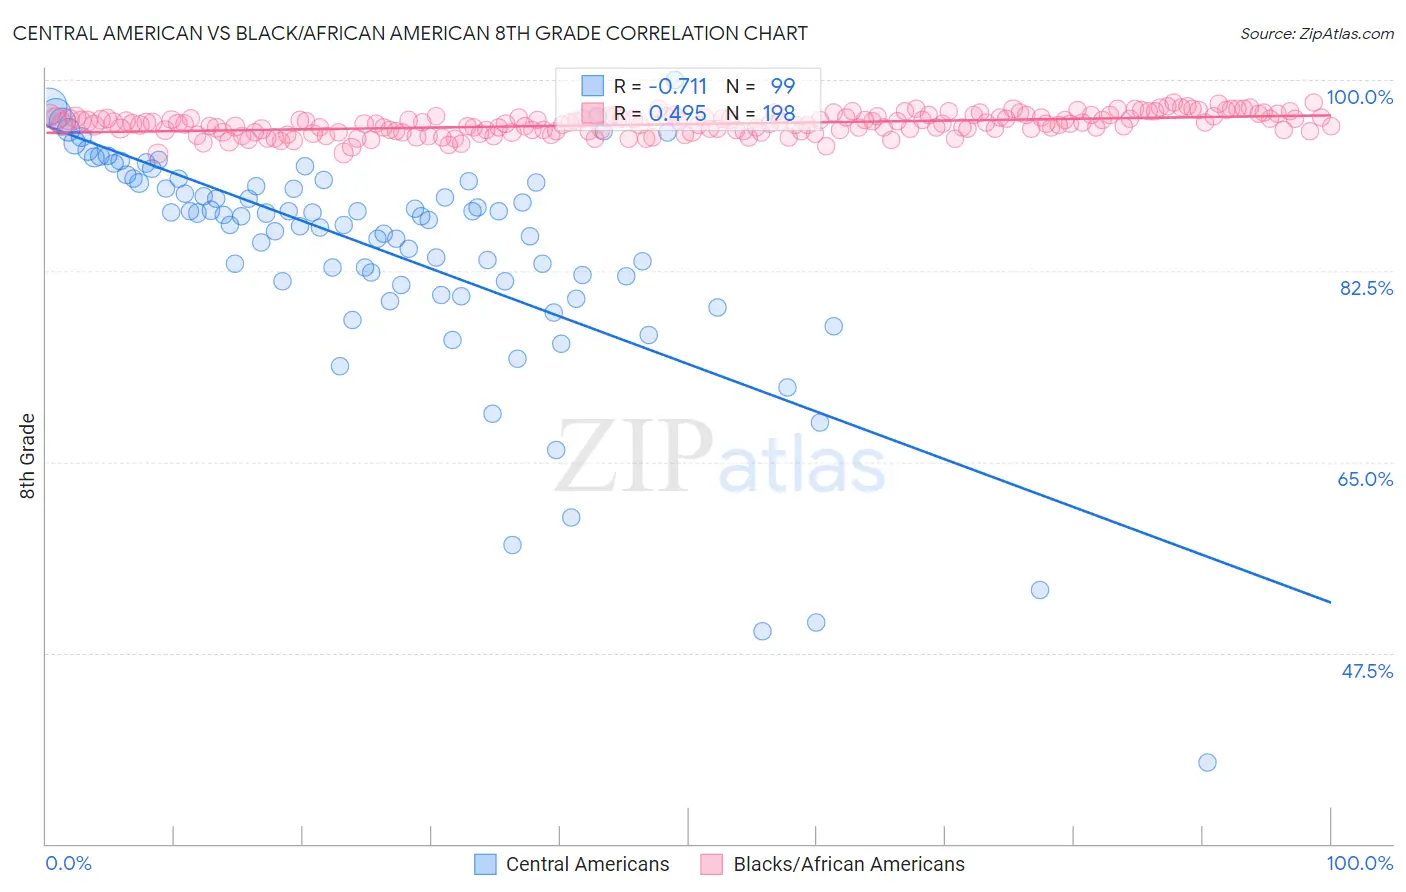
Central American vs Black/African American 8th Grade Correlation Chart
The statistical analysis conducted on geographies consisting of 504,619,347 people shows a strong negative correlation between the proportion of Central Americans and percentage of population with at least 8th grade education in the United States with a correlation coefficient (R) of -0.711 and weighted average of 91.6%. Similarly, the statistical analysis conducted on geographies consisting of 561,177,341 people shows a moderate positive correlation between the proportion of Blacks/African Americans and percentage of population with at least 8th grade education in the United States with a correlation coefficient (R) of 0.495 and weighted average of 95.6%, a difference of 4.4%.
8th Grade Correlation Summary
| Measurement | Central American | Black/African American |
| Minimum | 37.5% | 93.2% |
| Maximum | 100.0% | 98.0% |
| Range | 62.5% | 4.7% |
| Mean | 84.3% | 96.0% |
| Median | 87.6% | 96.0% |
| Interquartile 25% (IQ1) | 81.6% | 95.3% |
| Interquartile 75% (IQ3) | 90.8% | 96.6% |
| Interquartile Range (IQR) | 9.2% | 1.3% |
| Standard Deviation (Sample) | 10.8% | 0.93% |
| Standard Deviation (Population) | 10.7% | 0.93% |
Similar Demographics by 8th Grade
Demographics Similar to Central Americans by 8th Grade
In terms of 8th grade, the demographic groups most similar to Central Americans are Immigrants from Latin America (91.7%, a difference of 0.14%), Mexican (91.4%, a difference of 0.23%), Yakama (91.2%, a difference of 0.36%), Immigrants from Honduras (91.9%, a difference of 0.37%), and Guatemalan (91.1%, a difference of 0.47%).
| Demographics | Rating | Rank | 8th Grade |
| Hondurans | 0.0 /100 | #331 | Tragic 92.3% |
| Immigrants | Dominican Republic | 0.0 /100 | #332 | Tragic 92.3% |
| Hispanics or Latinos | 0.0 /100 | #333 | Tragic 92.2% |
| Immigrants | Yemen | 0.0 /100 | #334 | Tragic 92.1% |
| Mexican American Indians | 0.0 /100 | #335 | Tragic 92.1% |
| Immigrants | Honduras | 0.0 /100 | #336 | Tragic 91.9% |
| Immigrants | Latin America | 0.0 /100 | #337 | Tragic 91.7% |
| Central Americans | 0.0 /100 | #338 | Tragic 91.6% |
| Mexicans | 0.0 /100 | #339 | Tragic 91.4% |
| Yakama | 0.0 /100 | #340 | Tragic 91.2% |
| Guatemalans | 0.0 /100 | #341 | Tragic 91.1% |
| Salvadorans | 0.0 /100 | #342 | Tragic 90.9% |
| Immigrants | Guatemala | 0.0 /100 | #343 | Tragic 90.7% |
| Immigrants | Central America | 0.0 /100 | #344 | Tragic 90.4% |
| Immigrants | El Salvador | 0.0 /100 | #345 | Tragic 90.3% |
Demographics Similar to Blacks/African Americans by 8th Grade
In terms of 8th grade, the demographic groups most similar to Blacks/African Americans are Brazilian (95.6%, a difference of 0.0%), Immigrants from Iraq (95.6%, a difference of 0.010%), Immigrants from Uganda (95.6%, a difference of 0.010%), Sudanese (95.6%, a difference of 0.010%), and Immigrants from Egypt (95.7%, a difference of 0.020%).
| Demographics | Rating | Rank | 8th Grade |
| Venezuelans | 47.5 /100 | #178 | Average 95.7% |
| Immigrants | Brazil | 45.4 /100 | #179 | Average 95.7% |
| Iraqis | 40.5 /100 | #180 | Average 95.7% |
| Immigrants | Spain | 38.7 /100 | #181 | Fair 95.7% |
| Immigrants | Egypt | 37.9 /100 | #182 | Fair 95.7% |
| Immigrants | Iraq | 36.2 /100 | #183 | Fair 95.6% |
| Immigrants | Uganda | 36.0 /100 | #184 | Fair 95.6% |
| Blacks/African Americans | 34.8 /100 | #185 | Fair 95.6% |
| Brazilians | 34.8 /100 | #186 | Fair 95.6% |
| Sudanese | 33.0 /100 | #187 | Fair 95.6% |
| Liberians | 32.4 /100 | #188 | Fair 95.6% |
| Immigrants | Micronesia | 31.6 /100 | #189 | Fair 95.6% |
| Immigrants | Venezuela | 30.8 /100 | #190 | Fair 95.6% |
| Immigrants | Nepal | 30.2 /100 | #191 | Fair 95.6% |
| Pima | 28.6 /100 | #192 | Fair 95.6% |