Central American Indian vs Assyrian/Chaldean/Syriac 5th Grade
COMPARE
Central American Indian
Assyrian/Chaldean/Syriac
5th Grade
5th Grade Comparison
Central American Indians
Assyrians/Chaldeans/Syriacs
95.7%
5TH GRADE
0.0/ 100
METRIC RATING
320th/ 347
METRIC RANK
97.0%
5TH GRADE
4.5/ 100
METRIC RATING
228th/ 347
METRIC RANK
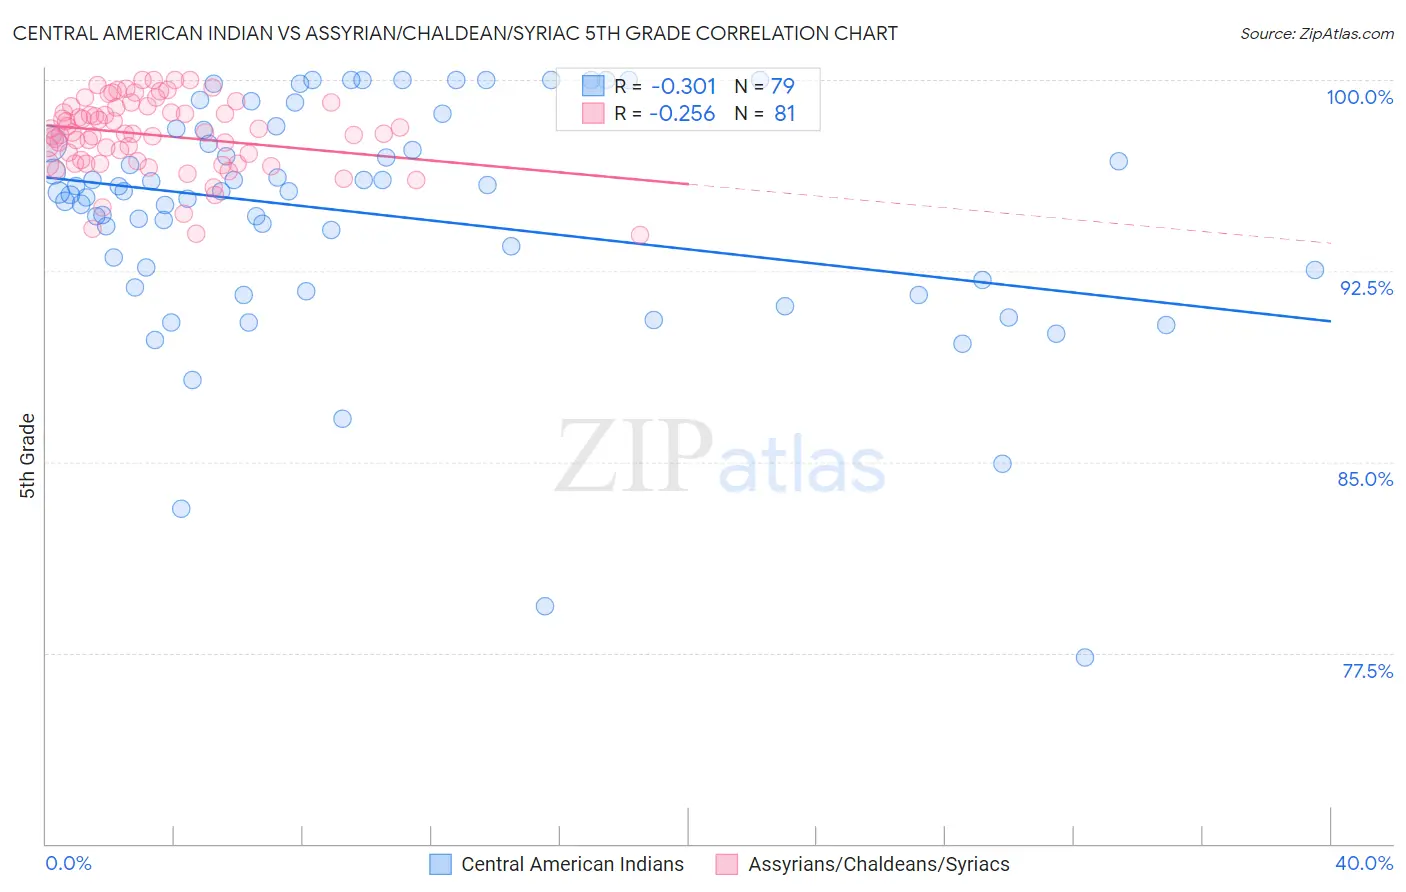
Central American Indian vs Assyrian/Chaldean/Syriac 5th Grade Correlation Chart
The statistical analysis conducted on geographies consisting of 326,142,721 people shows a mild negative correlation between the proportion of Central American Indians and percentage of population with at least 5th grade education in the United States with a correlation coefficient (R) of -0.301 and weighted average of 95.7%. Similarly, the statistical analysis conducted on geographies consisting of 110,318,304 people shows a weak negative correlation between the proportion of Assyrians/Chaldeans/Syriacs and percentage of population with at least 5th grade education in the United States with a correlation coefficient (R) of -0.256 and weighted average of 97.0%, a difference of 1.3%.
5th Grade Correlation Summary
| Measurement | Central American Indian | Assyrian/Chaldean/Syriac |
| Minimum | 77.3% | 93.9% |
| Maximum | 100.0% | 100.0% |
| Range | 22.7% | 6.1% |
| Mean | 94.7% | 97.8% |
| Median | 95.6% | 97.9% |
| Interquartile 25% (IQ1) | 92.2% | 96.8% |
| Interquartile 75% (IQ3) | 98.1% | 98.9% |
| Interquartile Range (IQR) | 5.9% | 2.2% |
| Standard Deviation (Sample) | 4.6% | 1.4% |
| Standard Deviation (Population) | 4.6% | 1.4% |
Similar Demographics by 5th Grade
Demographics Similar to Central American Indians by 5th Grade
In terms of 5th grade, the demographic groups most similar to Central American Indians are Japanese (95.7%, a difference of 0.0%), Immigrants from Vietnam (95.8%, a difference of 0.050%), Belizean (95.8%, a difference of 0.070%), Immigrants from Belize (95.7%, a difference of 0.080%), and Immigrants from Nicaragua (95.6%, a difference of 0.090%).
| Demographics | Rating | Rank | 5th Grade |
| Bangladeshis | 0.0 /100 | #313 | Tragic 95.9% |
| Immigrants | Portugal | 0.0 /100 | #314 | Tragic 95.9% |
| Nicaraguans | 0.0 /100 | #315 | Tragic 95.9% |
| Immigrants | Ecuador | 0.0 /100 | #316 | Tragic 95.8% |
| Belizeans | 0.0 /100 | #317 | Tragic 95.8% |
| Immigrants | Vietnam | 0.0 /100 | #318 | Tragic 95.8% |
| Japanese | 0.0 /100 | #319 | Tragic 95.7% |
| Central American Indians | 0.0 /100 | #320 | Tragic 95.7% |
| Immigrants | Belize | 0.0 /100 | #321 | Tragic 95.7% |
| Immigrants | Nicaragua | 0.0 /100 | #322 | Tragic 95.6% |
| Immigrants | Fiji | 0.0 /100 | #323 | Tragic 95.6% |
| Hondurans | 0.0 /100 | #324 | Tragic 95.6% |
| Hispanics or Latinos | 0.0 /100 | #325 | Tragic 95.6% |
| Immigrants | Cambodia | 0.0 /100 | #326 | Tragic 95.5% |
| Dominicans | 0.0 /100 | #327 | Tragic 95.5% |
Demographics Similar to Assyrians/Chaldeans/Syriacs by 5th Grade
In terms of 5th grade, the demographic groups most similar to Assyrians/Chaldeans/Syriacs are Yuman (97.0%, a difference of 0.0%), Immigrants from Western Asia (97.0%, a difference of 0.0%), Immigrants from Pakistan (97.0%, a difference of 0.010%), Immigrants from Malaysia (97.0%, a difference of 0.010%), and Immigrants from Eastern Asia (97.0%, a difference of 0.010%).
| Demographics | Rating | Rank | 5th Grade |
| Sierra Leoneans | 6.0 /100 | #221 | Tragic 97.1% |
| Immigrants | Panama | 5.7 /100 | #222 | Tragic 97.0% |
| Liberians | 5.7 /100 | #223 | Tragic 97.0% |
| South American Indians | 5.4 /100 | #224 | Tragic 97.0% |
| Bahamians | 5.3 /100 | #225 | Tragic 97.0% |
| Tongans | 5.3 /100 | #226 | Tragic 97.0% |
| Immigrants | Pakistan | 4.7 /100 | #227 | Tragic 97.0% |
| Assyrians/Chaldeans/Syriacs | 4.5 /100 | #228 | Tragic 97.0% |
| Yuman | 4.5 /100 | #229 | Tragic 97.0% |
| Immigrants | Western Asia | 4.3 /100 | #230 | Tragic 97.0% |
| Immigrants | Malaysia | 4.1 /100 | #231 | Tragic 97.0% |
| Immigrants | Eastern Asia | 4.0 /100 | #232 | Tragic 97.0% |
| Sub-Saharan Africans | 3.3 /100 | #233 | Tragic 97.0% |
| Tohono O'odham | 3.2 /100 | #234 | Tragic 97.0% |
| Uruguayans | 3.2 /100 | #235 | Tragic 97.0% |