Celtic vs Immigrants from England 12th Grade, No Diploma
COMPARE
Celtic
Immigrants from England
12th Grade, No Diploma
12th Grade, No Diploma Comparison
Celtics
Immigrants from England
92.3%
12TH GRADE, NO DIPLOMA
98.4/ 100
METRIC RATING
97th/ 347
METRIC RANK
92.6%
12TH GRADE, NO DIPLOMA
99.4/ 100
METRIC RATING
77th/ 347
METRIC RANK
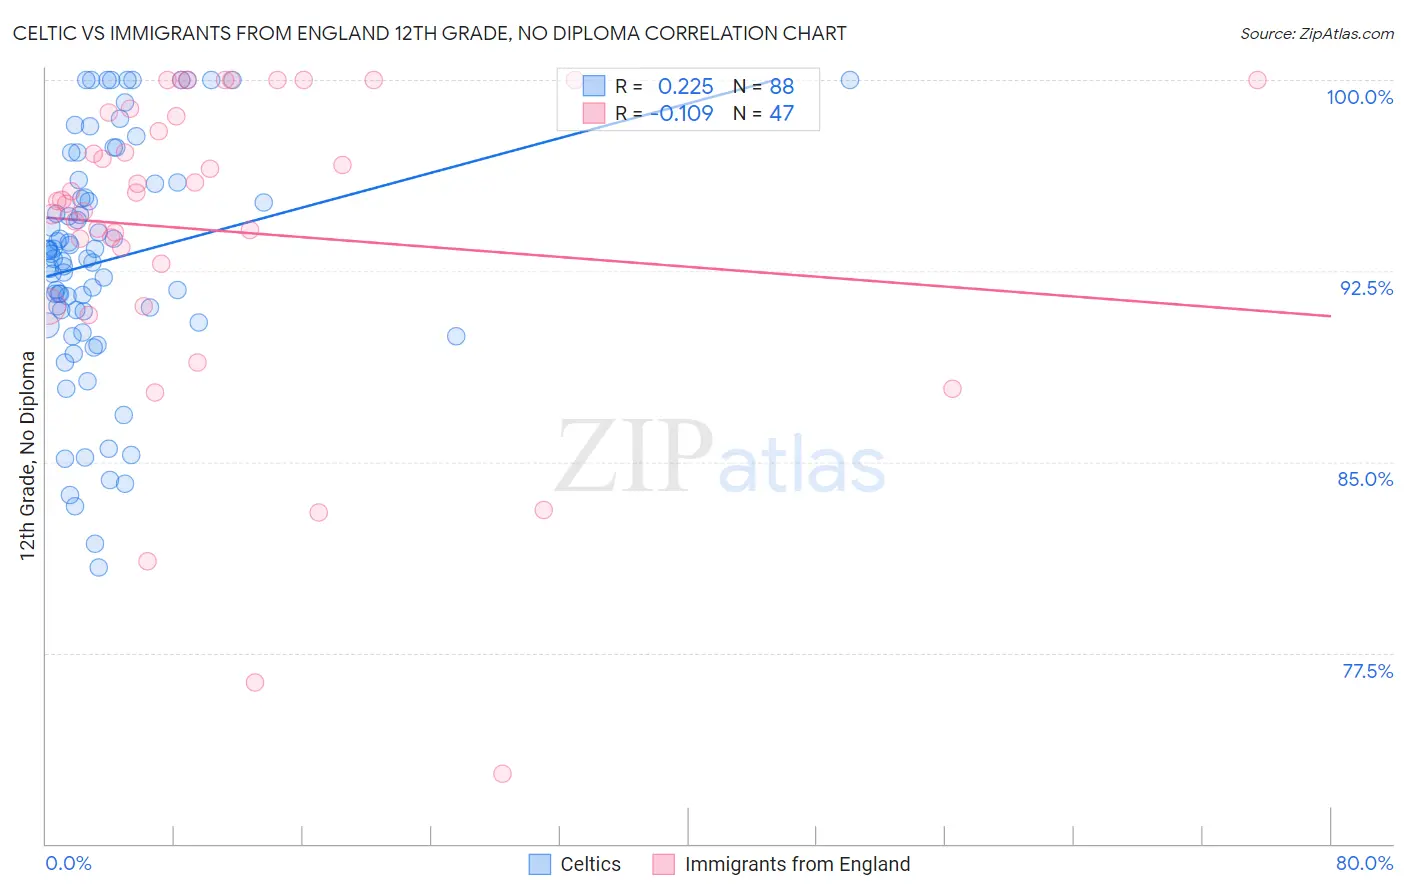
Celtic vs Immigrants from England 12th Grade, No Diploma Correlation Chart
The statistical analysis conducted on geographies consisting of 168,876,981 people shows a weak positive correlation between the proportion of Celtics and percentage of population with at least 12th grade (no diploma) education in the United States with a correlation coefficient (R) of 0.225 and weighted average of 92.3%. Similarly, the statistical analysis conducted on geographies consisting of 391,897,700 people shows a poor negative correlation between the proportion of Immigrants from England and percentage of population with at least 12th grade (no diploma) education in the United States with a correlation coefficient (R) of -0.109 and weighted average of 92.6%, a difference of 0.30%.
12th Grade, No Diploma Correlation Summary
| Measurement | Celtic | Immigrants from England |
| Minimum | 80.9% | 72.7% |
| Maximum | 100.0% | 100.0% |
| Range | 19.1% | 27.3% |
| Mean | 92.9% | 94.1% |
| Median | 93.1% | 95.3% |
| Interquartile 25% (IQ1) | 90.7% | 92.8% |
| Interquartile 75% (IQ3) | 96.0% | 98.7% |
| Interquartile Range (IQR) | 5.3% | 5.9% |
| Standard Deviation (Sample) | 4.7% | 6.3% |
| Standard Deviation (Population) | 4.6% | 6.2% |
Demographics Similar to Celtics and Immigrants from England by 12th Grade, No Diploma
In terms of 12th grade, no diploma, the demographic groups most similar to Celtics are Immigrants from Europe (92.3%, a difference of 0.010%), Immigrants from North Macedonia (92.3%, a difference of 0.010%), Icelander (92.3%, a difference of 0.010%), Immigrants from Romania (92.3%, a difference of 0.030%), and Immigrants from Western Europe (92.3%, a difference of 0.030%). Similarly, the demographic groups most similar to Immigrants from England are Cambodian (92.6%, a difference of 0.030%), Romanian (92.6%, a difference of 0.030%), French Canadian (92.6%, a difference of 0.040%), Immigrants from Denmark (92.5%, a difference of 0.060%), and Immigrants from Switzerland (92.5%, a difference of 0.070%).
| Demographics | Rating | Rank | 12th Grade, No Diploma |
| Immigrants | England | 99.4 /100 | #77 | Exceptional 92.6% |
| Cambodians | 99.3 /100 | #78 | Exceptional 92.6% |
| Romanians | 99.3 /100 | #79 | Exceptional 92.6% |
| French Canadians | 99.3 /100 | #80 | Exceptional 92.6% |
| Immigrants | Denmark | 99.2 /100 | #81 | Exceptional 92.5% |
| Immigrants | Switzerland | 99.2 /100 | #82 | Exceptional 92.5% |
| Immigrants | Israel | 99.2 /100 | #83 | Exceptional 92.5% |
| Immigrants | Bulgaria | 99.1 /100 | #84 | Exceptional 92.5% |
| Immigrants | Saudi Arabia | 99.0 /100 | #85 | Exceptional 92.5% |
| Immigrants | Turkey | 98.9 /100 | #86 | Exceptional 92.4% |
| Immigrants | France | 98.8 /100 | #87 | Exceptional 92.4% |
| Scotch-Irish | 98.8 /100 | #88 | Exceptional 92.4% |
| Canadians | 98.7 /100 | #89 | Exceptional 92.4% |
| Immigrants | Serbia | 98.6 /100 | #90 | Exceptional 92.4% |
| South Africans | 98.6 /100 | #91 | Exceptional 92.4% |
| Immigrants | Romania | 98.5 /100 | #92 | Exceptional 92.3% |
| Immigrants | Western Europe | 98.5 /100 | #93 | Exceptional 92.3% |
| Immigrants | Europe | 98.5 /100 | #94 | Exceptional 92.3% |
| Immigrants | North Macedonia | 98.5 /100 | #95 | Exceptional 92.3% |
| Icelanders | 98.5 /100 | #96 | Exceptional 92.3% |
| Celtics | 98.4 /100 | #97 | Exceptional 92.3% |