Celtic vs Cherokee 5th Grade
COMPARE
Celtic
Cherokee
5th Grade
5th Grade Comparison
Celtics
Cherokee
98.0%
5TH GRADE
99.8/ 100
METRIC RATING
51st/ 347
METRIC RANK
97.8%
5TH GRADE
99.4/ 100
METRIC RATING
73rd/ 347
METRIC RANK
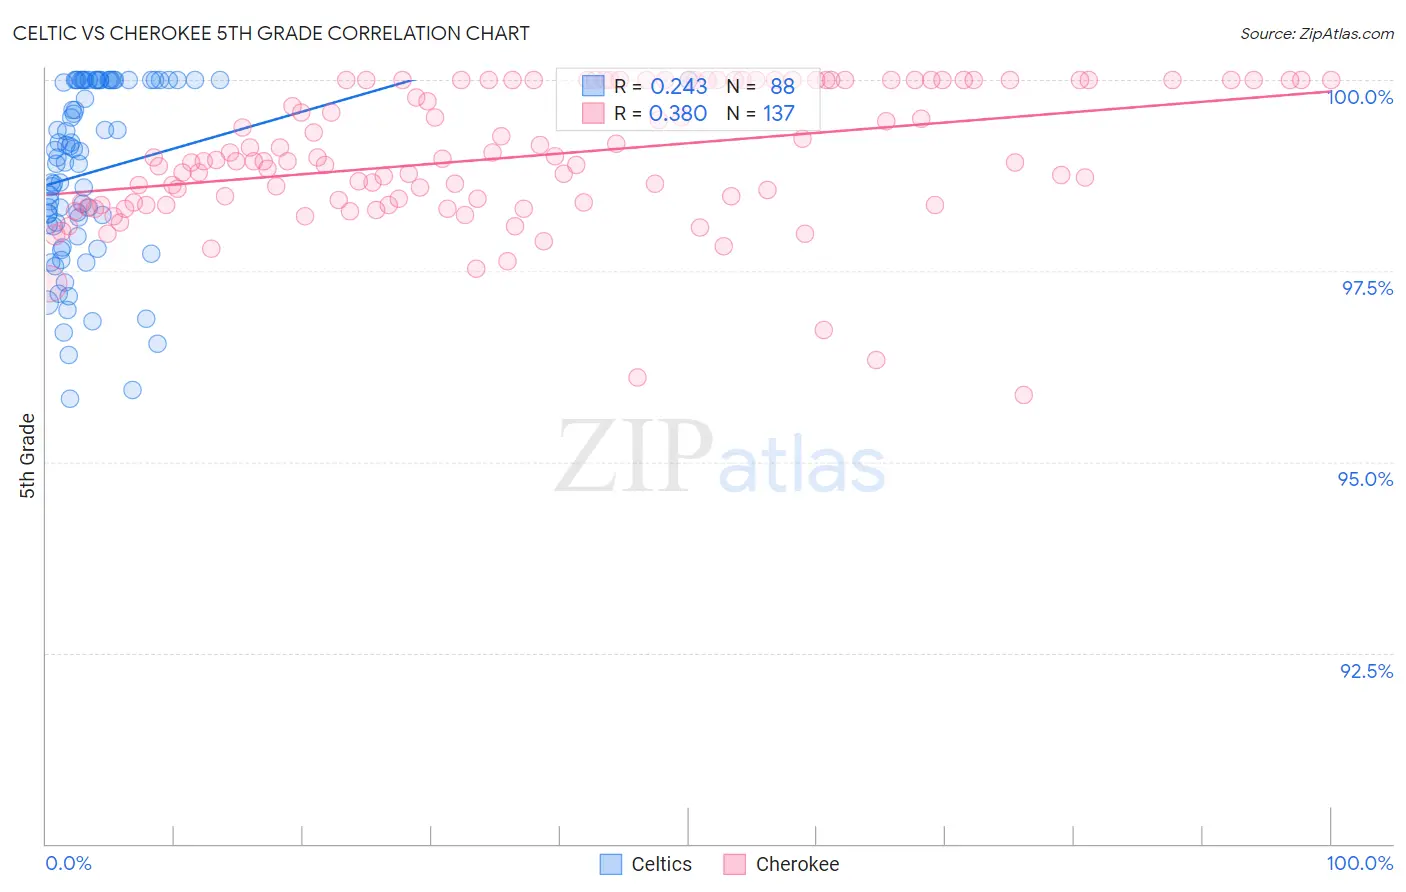
Celtic vs Cherokee 5th Grade Correlation Chart
The statistical analysis conducted on geographies consisting of 168,875,705 people shows a weak positive correlation between the proportion of Celtics and percentage of population with at least 5th grade education in the United States with a correlation coefficient (R) of 0.243 and weighted average of 98.0%. Similarly, the statistical analysis conducted on geographies consisting of 493,719,253 people shows a mild positive correlation between the proportion of Cherokee and percentage of population with at least 5th grade education in the United States with a correlation coefficient (R) of 0.380 and weighted average of 97.8%, a difference of 0.14%.
5th Grade Correlation Summary
| Measurement | Celtic | Cherokee |
| Minimum | 95.8% | 95.9% |
| Maximum | 100.0% | 100.0% |
| Range | 4.2% | 4.1% |
| Mean | 98.8% | 99.0% |
| Median | 99.0% | 98.9% |
| Interquartile 25% (IQ1) | 98.1% | 98.4% |
| Interquartile 75% (IQ3) | 100.0% | 100.0% |
| Interquartile Range (IQR) | 1.9% | 1.6% |
| Standard Deviation (Sample) | 1.1% | 0.89% |
| Standard Deviation (Population) | 1.1% | 0.88% |
Similar Demographics by 5th Grade
Demographics Similar to Celtics by 5th Grade
In terms of 5th grade, the demographic groups most similar to Celtics are Estonian (98.0%, a difference of 0.0%), Immigrants from Scotland (98.0%, a difference of 0.0%), Bulgarian (98.0%, a difference of 0.010%), Maltese (98.0%, a difference of 0.010%), and Slavic (98.0%, a difference of 0.010%).
| Demographics | Rating | Rank | 5th Grade |
| Aleuts | 99.9 /100 | #44 | Exceptional 98.0% |
| Czechoslovakians | 99.9 /100 | #45 | Exceptional 98.0% |
| Arapaho | 99.9 /100 | #46 | Exceptional 98.0% |
| Native Hawaiians | 99.9 /100 | #47 | Exceptional 98.0% |
| Bulgarians | 99.8 /100 | #48 | Exceptional 98.0% |
| Estonians | 99.8 /100 | #49 | Exceptional 98.0% |
| Immigrants | Scotland | 99.8 /100 | #50 | Exceptional 98.0% |
| Celtics | 99.8 /100 | #51 | Exceptional 98.0% |
| Maltese | 99.8 /100 | #52 | Exceptional 98.0% |
| Slavs | 99.8 /100 | #53 | Exceptional 98.0% |
| Australians | 99.8 /100 | #54 | Exceptional 98.0% |
| Creek | 99.8 /100 | #55 | Exceptional 98.0% |
| Greeks | 99.8 /100 | #56 | Exceptional 97.9% |
| Austrians | 99.8 /100 | #57 | Exceptional 97.9% |
| Whites/Caucasians | 99.8 /100 | #58 | Exceptional 97.9% |
Demographics Similar to Cherokee by 5th Grade
In terms of 5th grade, the demographic groups most similar to Cherokee are Lumbee (97.8%, a difference of 0.0%), Macedonian (97.9%, a difference of 0.010%), Ukrainian (97.8%, a difference of 0.010%), Immigrants from Netherlands (97.8%, a difference of 0.010%), and Immigrants from England (97.8%, a difference of 0.010%).
| Demographics | Rating | Rank | 5th Grade |
| Immigrants | Austria | 99.6 /100 | #66 | Exceptional 97.9% |
| New Zealanders | 99.6 /100 | #67 | Exceptional 97.9% |
| Cajuns | 99.6 /100 | #68 | Exceptional 97.9% |
| Kiowa | 99.5 /100 | #69 | Exceptional 97.9% |
| Iranians | 99.5 /100 | #70 | Exceptional 97.9% |
| Chickasaw | 99.5 /100 | #71 | Exceptional 97.9% |
| Macedonians | 99.4 /100 | #72 | Exceptional 97.9% |
| Cherokee | 99.4 /100 | #73 | Exceptional 97.8% |
| Lumbee | 99.3 /100 | #74 | Exceptional 97.8% |
| Ukrainians | 99.3 /100 | #75 | Exceptional 97.8% |
| Immigrants | Netherlands | 99.3 /100 | #76 | Exceptional 97.8% |
| Immigrants | England | 99.3 /100 | #77 | Exceptional 97.8% |
| Osage | 99.3 /100 | #78 | Exceptional 97.8% |
| Immigrants | Lithuania | 99.2 /100 | #79 | Exceptional 97.8% |
| Immigrants | India | 99.2 /100 | #80 | Exceptional 97.8% |