Celtic vs Alaska Native 7th Grade
COMPARE
Celtic
Alaska Native
7th Grade
7th Grade Comparison
Celtics
Alaska Natives
97.1%
7TH GRADE
99.9/ 100
METRIC RATING
48th/ 347
METRIC RANK
97.3%
7TH GRADE
100.0/ 100
METRIC RATING
34th/ 347
METRIC RANK
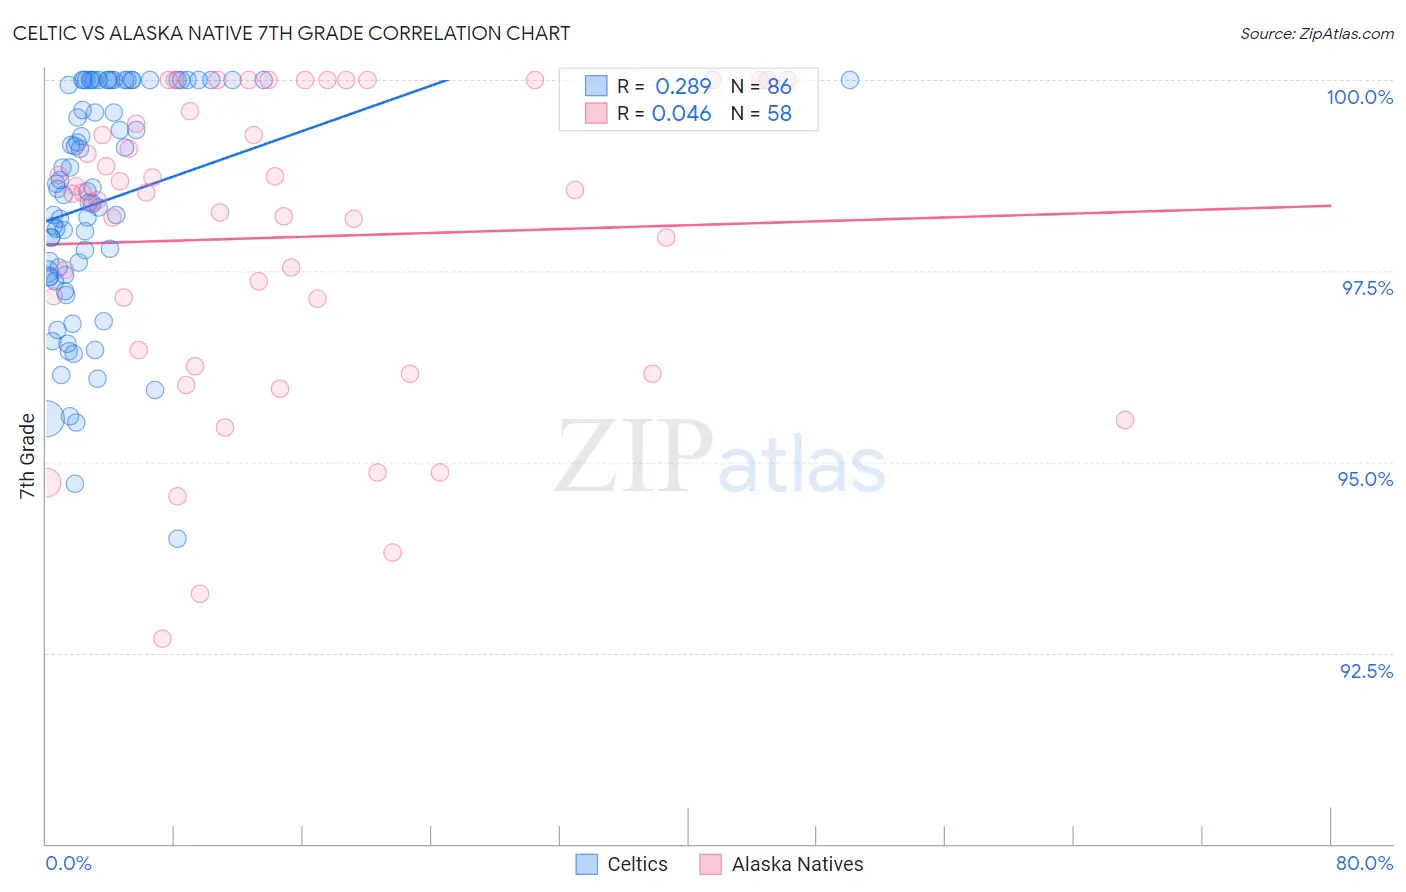
Celtic vs Alaska Native 7th Grade Correlation Chart
The statistical analysis conducted on geographies consisting of 168,875,339 people shows a weak positive correlation between the proportion of Celtics and percentage of population with at least 7th grade education in the United States with a correlation coefficient (R) of 0.289 and weighted average of 97.1%. Similarly, the statistical analysis conducted on geographies consisting of 76,778,057 people shows no correlation between the proportion of Alaska Natives and percentage of population with at least 7th grade education in the United States with a correlation coefficient (R) of 0.046 and weighted average of 97.3%, a difference of 0.24%.
7th Grade Correlation Summary
| Measurement | Celtic | Alaska Native |
| Minimum | 94.0% | 92.7% |
| Maximum | 100.0% | 100.0% |
| Range | 6.0% | 7.3% |
| Mean | 98.4% | 97.9% |
| Median | 98.6% | 98.5% |
| Interquartile 25% (IQ1) | 97.4% | 96.5% |
| Interquartile 75% (IQ3) | 100.0% | 99.6% |
| Interquartile Range (IQR) | 2.6% | 3.1% |
| Standard Deviation (Sample) | 1.5% | 2.0% |
| Standard Deviation (Population) | 1.5% | 1.9% |
Demographics Similar to Celtics and Alaska Natives by 7th Grade
In terms of 7th grade, the demographic groups most similar to Celtics are Bulgarian (97.1%, a difference of 0.010%), Slavic (97.1%, a difference of 0.010%), Immigrants from Scotland (97.1%, a difference of 0.010%), Czechoslovakian (97.1%, a difference of 0.030%), and Aleut (97.1%, a difference of 0.030%). Similarly, the demographic groups most similar to Alaska Natives are Chippewa (97.3%, a difference of 0.030%), Swiss (97.3%, a difference of 0.030%), European (97.3%, a difference of 0.040%), Italian (97.3%, a difference of 0.040%), and Hungarian (97.2%, a difference of 0.070%).
| Demographics | Rating | Rank | 7th Grade |
| Europeans | 100.0 /100 | #31 | Exceptional 97.3% |
| Italians | 100.0 /100 | #32 | Exceptional 97.3% |
| Chippewa | 100.0 /100 | #33 | Exceptional 97.3% |
| Alaska Natives | 100.0 /100 | #34 | Exceptional 97.3% |
| Swiss | 100.0 /100 | #35 | Exceptional 97.3% |
| Hungarians | 100.0 /100 | #36 | Exceptional 97.2% |
| British | 100.0 /100 | #37 | Exceptional 97.2% |
| Belgians | 100.0 /100 | #38 | Exceptional 97.2% |
| Latvians | 100.0 /100 | #39 | Exceptional 97.2% |
| Luxembourgers | 100.0 /100 | #40 | Exceptional 97.2% |
| Eastern Europeans | 100.0 /100 | #41 | Exceptional 97.2% |
| Chinese | 99.9 /100 | #42 | Exceptional 97.1% |
| Maltese | 99.9 /100 | #43 | Exceptional 97.1% |
| Northern Europeans | 99.9 /100 | #44 | Exceptional 97.1% |
| Czechoslovakians | 99.9 /100 | #45 | Exceptional 97.1% |
| Aleuts | 99.9 /100 | #46 | Exceptional 97.1% |
| Bulgarians | 99.9 /100 | #47 | Exceptional 97.1% |
| Celtics | 99.9 /100 | #48 | Exceptional 97.1% |
| Slavs | 99.9 /100 | #49 | Exceptional 97.1% |
| Immigrants | Scotland | 99.9 /100 | #50 | Exceptional 97.1% |
| Estonians | 99.9 /100 | #51 | Exceptional 97.0% |