Carpatho Rusyn vs Comanche Kindergarten
COMPARE
Carpatho Rusyn
Comanche
Kindergarten
Kindergarten Comparison
Carpatho Rusyns
Comanche
98.7%
KINDERGARTEN
100.0/ 100
METRIC RATING
13th/ 347
METRIC RANK
98.0%
KINDERGARTEN
68.3/ 100
METRIC RATING
155th/ 347
METRIC RANK
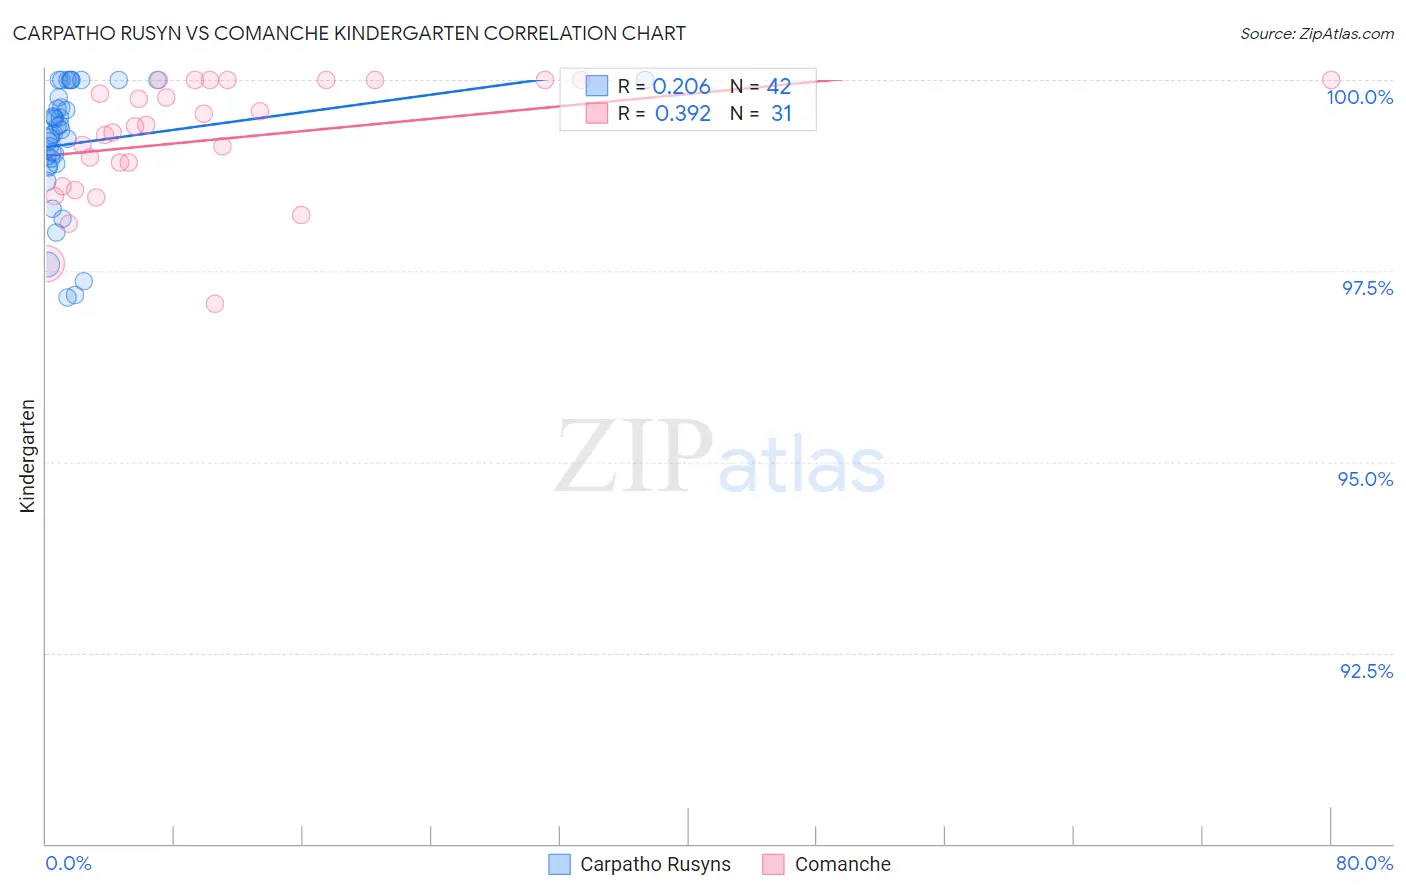
Carpatho Rusyn vs Comanche Kindergarten Correlation Chart
The statistical analysis conducted on geographies consisting of 58,871,690 people shows a weak positive correlation between the proportion of Carpatho Rusyns and percentage of population with at least kindergarten education in the United States with a correlation coefficient (R) of 0.206 and weighted average of 98.7%. Similarly, the statistical analysis conducted on geographies consisting of 109,786,530 people shows a mild positive correlation between the proportion of Comanche and percentage of population with at least kindergarten education in the United States with a correlation coefficient (R) of 0.392 and weighted average of 98.0%, a difference of 0.67%.
Kindergarten Correlation Summary
| Measurement | Carpatho Rusyn | Comanche |
| Minimum | 97.2% | 97.1% |
| Maximum | 100.0% | 100.0% |
| Range | 2.8% | 2.9% |
| Mean | 99.2% | 99.2% |
| Median | 99.3% | 99.4% |
| Interquartile 25% (IQ1) | 98.9% | 98.6% |
| Interquartile 75% (IQ3) | 99.8% | 100.0% |
| Interquartile Range (IQR) | 0.86% | 1.4% |
| Standard Deviation (Sample) | 0.80% | 0.78% |
| Standard Deviation (Population) | 0.79% | 0.77% |
Similar Demographics by Kindergarten
Demographics Similar to Carpatho Rusyns by Kindergarten
In terms of kindergarten, the demographic groups most similar to Carpatho Rusyns are English (98.7%, a difference of 0.0%), Slovene (98.7%, a difference of 0.010%), Swedish (98.7%, a difference of 0.020%), Aleut (98.6%, a difference of 0.030%), and Scottish (98.6%, a difference of 0.030%).
| Demographics | Rating | Rank | Kindergarten |
| Alaskan Athabascans | 100.0 /100 | #6 | Exceptional 98.8% |
| Alaska Natives | 100.0 /100 | #7 | Exceptional 98.7% |
| Norwegians | 100.0 /100 | #8 | Exceptional 98.7% |
| Tlingit-Haida | 100.0 /100 | #9 | Exceptional 98.7% |
| Slovaks | 100.0 /100 | #10 | Exceptional 98.7% |
| Germans | 100.0 /100 | #11 | Exceptional 98.7% |
| Slovenes | 100.0 /100 | #12 | Exceptional 98.7% |
| Carpatho Rusyns | 100.0 /100 | #13 | Exceptional 98.7% |
| English | 100.0 /100 | #14 | Exceptional 98.7% |
| Swedes | 100.0 /100 | #15 | Exceptional 98.7% |
| Aleuts | 100.0 /100 | #16 | Exceptional 98.6% |
| Scottish | 100.0 /100 | #17 | Exceptional 98.6% |
| Dutch | 100.0 /100 | #18 | Exceptional 98.6% |
| Irish | 100.0 /100 | #19 | Exceptional 98.6% |
| Pennsylvania Germans | 100.0 /100 | #20 | Exceptional 98.6% |
Demographics Similar to Comanche by Kindergarten
In terms of kindergarten, the demographic groups most similar to Comanche are Immigrants from Moldova (98.0%, a difference of 0.0%), Immigrants from Iran (98.0%, a difference of 0.0%), Soviet Union (98.0%, a difference of 0.010%), Dutch West Indian (98.0%, a difference of 0.010%), and Immigrants from South Central Asia (98.0%, a difference of 0.010%).
| Demographics | Rating | Rank | Kindergarten |
| Apache | 75.0 /100 | #148 | Good 98.0% |
| Immigrants | Greece | 74.9 /100 | #149 | Good 98.0% |
| Jordanians | 72.8 /100 | #150 | Good 98.0% |
| Soviet Union | 70.8 /100 | #151 | Good 98.0% |
| Dutch West Indians | 70.1 /100 | #152 | Good 98.0% |
| Immigrants | Moldova | 69.1 /100 | #153 | Good 98.0% |
| Immigrants | Iran | 68.8 /100 | #154 | Good 98.0% |
| Comanche | 68.3 /100 | #155 | Good 98.0% |
| Immigrants | South Central Asia | 66.6 /100 | #156 | Good 98.0% |
| Immigrants | North Macedonia | 66.4 /100 | #157 | Good 98.0% |
| Venezuelans | 64.7 /100 | #158 | Good 98.0% |
| French American Indians | 63.7 /100 | #159 | Good 98.0% |
| Immigrants | Russia | 59.0 /100 | #160 | Average 98.0% |
| Immigrants | Eastern Europe | 59.0 /100 | #161 | Average 98.0% |
| Immigrants | Italy | 58.9 /100 | #162 | Average 98.0% |