Cape Verdean vs Lebanese 8th Grade
COMPARE
Cape Verdean
Lebanese
8th Grade
8th Grade Comparison
Cape Verdeans
Lebanese
93.5%
8TH GRADE
0.0/ 100
METRIC RATING
312th/ 347
METRIC RANK
96.3%
8TH GRADE
97.5/ 100
METRIC RATING
108th/ 347
METRIC RANK
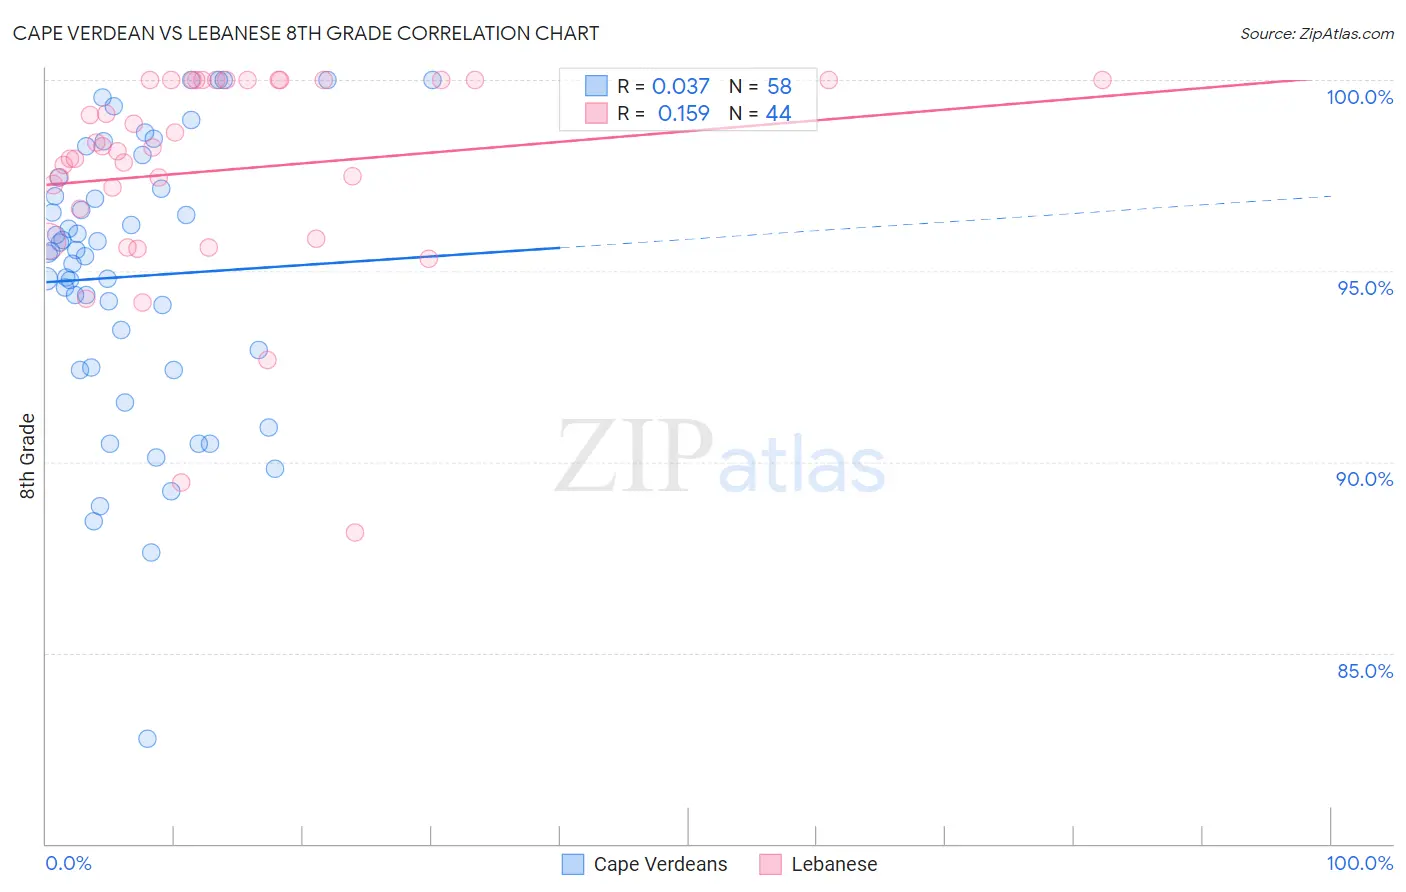
Cape Verdean vs Lebanese 8th Grade Correlation Chart
The statistical analysis conducted on geographies consisting of 107,537,955 people shows no correlation between the proportion of Cape Verdeans and percentage of population with at least 8th grade education in the United States with a correlation coefficient (R) of 0.037 and weighted average of 93.5%. Similarly, the statistical analysis conducted on geographies consisting of 401,624,157 people shows a poor positive correlation between the proportion of Lebanese and percentage of population with at least 8th grade education in the United States with a correlation coefficient (R) of 0.159 and weighted average of 96.3%, a difference of 3.0%.
8th Grade Correlation Summary
| Measurement | Cape Verdean | Lebanese |
| Minimum | 82.8% | 88.2% |
| Maximum | 100.0% | 100.0% |
| Range | 17.2% | 11.8% |
| Mean | 94.9% | 97.6% |
| Median | 95.5% | 98.2% |
| Interquartile 25% (IQ1) | 92.5% | 96.2% |
| Interquartile 75% (IQ3) | 97.2% | 100.0% |
| Interquartile Range (IQR) | 4.7% | 3.8% |
| Standard Deviation (Sample) | 3.6% | 2.7% |
| Standard Deviation (Population) | 3.6% | 2.7% |
Similar Demographics by 8th Grade
Demographics Similar to Cape Verdeans by 8th Grade
In terms of 8th grade, the demographic groups most similar to Cape Verdeans are Immigrants from Caribbean (93.5%, a difference of 0.030%), Japanese (93.6%, a difference of 0.040%), Immigrants from Bangladesh (93.6%, a difference of 0.040%), Immigrants from Vietnam (93.5%, a difference of 0.040%), and Immigrants (93.6%, a difference of 0.050%).
| Demographics | Rating | Rank | 8th Grade |
| Immigrants | Haiti | 0.0 /100 | #305 | Tragic 93.9% |
| Immigrants | Guyana | 0.0 /100 | #306 | Tragic 93.8% |
| Immigrants | Portugal | 0.0 /100 | #307 | Tragic 93.8% |
| Ecuadorians | 0.0 /100 | #308 | Tragic 93.6% |
| Immigrants | Immigrants | 0.0 /100 | #309 | Tragic 93.6% |
| Japanese | 0.0 /100 | #310 | Tragic 93.6% |
| Immigrants | Bangladesh | 0.0 /100 | #311 | Tragic 93.6% |
| Cape Verdeans | 0.0 /100 | #312 | Tragic 93.5% |
| Immigrants | Caribbean | 0.0 /100 | #313 | Tragic 93.5% |
| Immigrants | Vietnam | 0.0 /100 | #314 | Tragic 93.5% |
| Vietnamese | 0.0 /100 | #315 | Tragic 93.5% |
| Immigrants | Cambodia | 0.0 /100 | #316 | Tragic 93.3% |
| Immigrants | Ecuador | 0.0 /100 | #317 | Tragic 93.3% |
| Puerto Ricans | 0.0 /100 | #318 | Tragic 93.2% |
| Immigrants | Cuba | 0.0 /100 | #319 | Tragic 93.2% |
Demographics Similar to Lebanese by 8th Grade
In terms of 8th grade, the demographic groups most similar to Lebanese are Iroquois (96.3%, a difference of 0.0%), Immigrants from Latvia (96.3%, a difference of 0.020%), Immigrants from Saudi Arabia (96.3%, a difference of 0.030%), Kiowa (96.3%, a difference of 0.030%), and Immigrants from North Macedonia (96.3%, a difference of 0.030%).
| Demographics | Rating | Rank | 8th Grade |
| Bhutanese | 98.2 /100 | #101 | Exceptional 96.4% |
| South Africans | 98.2 /100 | #102 | Exceptional 96.4% |
| Immigrants | Saudi Arabia | 98.0 /100 | #103 | Exceptional 96.3% |
| Kiowa | 98.0 /100 | #104 | Exceptional 96.3% |
| Immigrants | North Macedonia | 98.0 /100 | #105 | Exceptional 96.3% |
| Okinawans | 98.0 /100 | #106 | Exceptional 96.3% |
| Immigrants | Latvia | 97.8 /100 | #107 | Exceptional 96.3% |
| Lebanese | 97.5 /100 | #108 | Exceptional 96.3% |
| Iroquois | 97.5 /100 | #109 | Exceptional 96.3% |
| Cajuns | 97.1 /100 | #110 | Exceptional 96.3% |
| Shoshone | 96.8 /100 | #111 | Exceptional 96.3% |
| Syrians | 96.7 /100 | #112 | Exceptional 96.3% |
| Immigrants | Zimbabwe | 96.7 /100 | #113 | Exceptional 96.3% |
| Immigrants | Japan | 96.5 /100 | #114 | Exceptional 96.2% |
| Immigrants | Moldova | 96.5 /100 | #115 | Exceptional 96.2% |