Cape Verdean vs Jamaican 5th Grade
COMPARE
Cape Verdean
Jamaican
5th Grade
5th Grade Comparison
Cape Verdeans
Jamaicans
95.5%
5TH GRADE
0.0/ 100
METRIC RATING
328th/ 347
METRIC RANK
96.9%
5TH GRADE
0.9/ 100
METRIC RATING
252nd/ 347
METRIC RANK
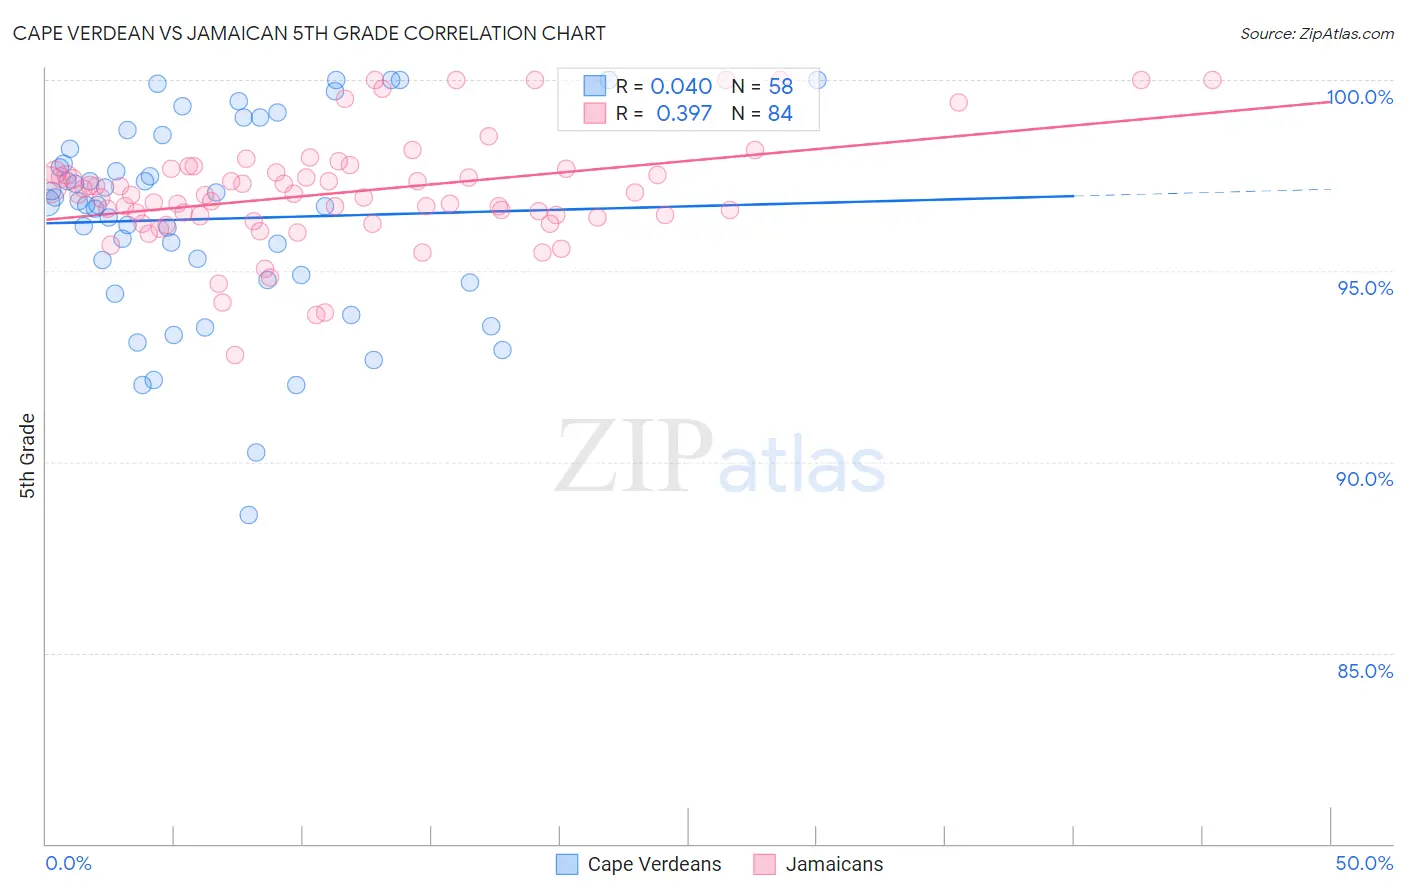
Cape Verdean vs Jamaican 5th Grade Correlation Chart
The statistical analysis conducted on geographies consisting of 107,537,955 people shows no correlation between the proportion of Cape Verdeans and percentage of population with at least 5th grade education in the United States with a correlation coefficient (R) of 0.040 and weighted average of 95.5%. Similarly, the statistical analysis conducted on geographies consisting of 368,084,189 people shows a mild positive correlation between the proportion of Jamaicans and percentage of population with at least 5th grade education in the United States with a correlation coefficient (R) of 0.397 and weighted average of 96.9%, a difference of 1.4%.
5th Grade Correlation Summary
| Measurement | Cape Verdean | Jamaican |
| Minimum | 88.6% | 92.8% |
| Maximum | 100.0% | 100.0% |
| Range | 11.4% | 7.2% |
| Mean | 96.4% | 97.1% |
| Median | 96.8% | 97.0% |
| Interquartile 25% (IQ1) | 94.8% | 96.4% |
| Interquartile 75% (IQ3) | 98.2% | 97.6% |
| Interquartile Range (IQR) | 3.4% | 1.2% |
| Standard Deviation (Sample) | 2.6% | 1.4% |
| Standard Deviation (Population) | 2.6% | 1.4% |
Similar Demographics by 5th Grade
Demographics Similar to Cape Verdeans by 5th Grade
In terms of 5th grade, the demographic groups most similar to Cape Verdeans are Mexican American Indian (95.5%, a difference of 0.010%), Immigrants from Cambodia (95.5%, a difference of 0.030%), Dominican (95.5%, a difference of 0.030%), Hispanic or Latino (95.6%, a difference of 0.060%), and Honduran (95.6%, a difference of 0.070%).
| Demographics | Rating | Rank | 5th Grade |
| Immigrants | Belize | 0.0 /100 | #321 | Tragic 95.7% |
| Immigrants | Nicaragua | 0.0 /100 | #322 | Tragic 95.6% |
| Immigrants | Fiji | 0.0 /100 | #323 | Tragic 95.6% |
| Hondurans | 0.0 /100 | #324 | Tragic 95.6% |
| Hispanics or Latinos | 0.0 /100 | #325 | Tragic 95.6% |
| Immigrants | Cambodia | 0.0 /100 | #326 | Tragic 95.5% |
| Dominicans | 0.0 /100 | #327 | Tragic 95.5% |
| Cape Verdeans | 0.0 /100 | #328 | Tragic 95.5% |
| Mexican American Indians | 0.0 /100 | #329 | Tragic 95.5% |
| Immigrants | Armenia | 0.0 /100 | #330 | Tragic 95.4% |
| Immigrants | Honduras | 0.0 /100 | #331 | Tragic 95.4% |
| Immigrants | Dominican Republic | 0.0 /100 | #332 | Tragic 95.3% |
| Immigrants | Latin America | 0.0 /100 | #333 | Tragic 95.3% |
| Nepalese | 0.0 /100 | #334 | Tragic 95.2% |
| Mexicans | 0.0 /100 | #335 | Tragic 95.2% |
Demographics Similar to Jamaicans by 5th Grade
In terms of 5th grade, the demographic groups most similar to Jamaicans are Bolivian (96.9%, a difference of 0.0%), Immigrants from Uruguay (96.9%, a difference of 0.010%), Immigrants from Liberia (96.9%, a difference of 0.010%), Immigrants from Middle Africa (96.8%, a difference of 0.010%), and Immigrants from Africa (96.9%, a difference of 0.020%).
| Demographics | Rating | Rank | 5th Grade |
| Colombians | 1.3 /100 | #245 | Tragic 96.9% |
| Ethiopians | 1.2 /100 | #246 | Tragic 96.9% |
| Immigrants | Africa | 1.1 /100 | #247 | Tragic 96.9% |
| U.S. Virgin Islanders | 1.1 /100 | #248 | Tragic 96.9% |
| Immigrants | Uruguay | 1.0 /100 | #249 | Tragic 96.9% |
| Immigrants | Liberia | 1.0 /100 | #250 | Tragic 96.9% |
| Bolivians | 0.9 /100 | #251 | Tragic 96.9% |
| Jamaicans | 0.9 /100 | #252 | Tragic 96.9% |
| Immigrants | Middle Africa | 0.8 /100 | #253 | Tragic 96.8% |
| Immigrants | Senegal | 0.8 /100 | #254 | Tragic 96.8% |
| South Americans | 0.7 /100 | #255 | Tragic 96.8% |
| Immigrants | Congo | 0.7 /100 | #256 | Tragic 96.8% |
| Peruvians | 0.6 /100 | #257 | Tragic 96.8% |
| Immigrants | Ethiopia | 0.5 /100 | #258 | Tragic 96.8% |
| Immigrants | China | 0.5 /100 | #259 | Tragic 96.8% |