Cape Verdean vs Immigrants from Uruguay Nursery School
COMPARE
Cape Verdean
Immigrants from Uruguay
Nursery School
Nursery School Comparison
Cape Verdeans
Immigrants from Uruguay
97.0%
NURSERY SCHOOL
0.0/ 100
METRIC RATING
314th/ 347
METRIC RANK
97.7%
NURSERY SCHOOL
2.3/ 100
METRIC RATING
232nd/ 347
METRIC RANK
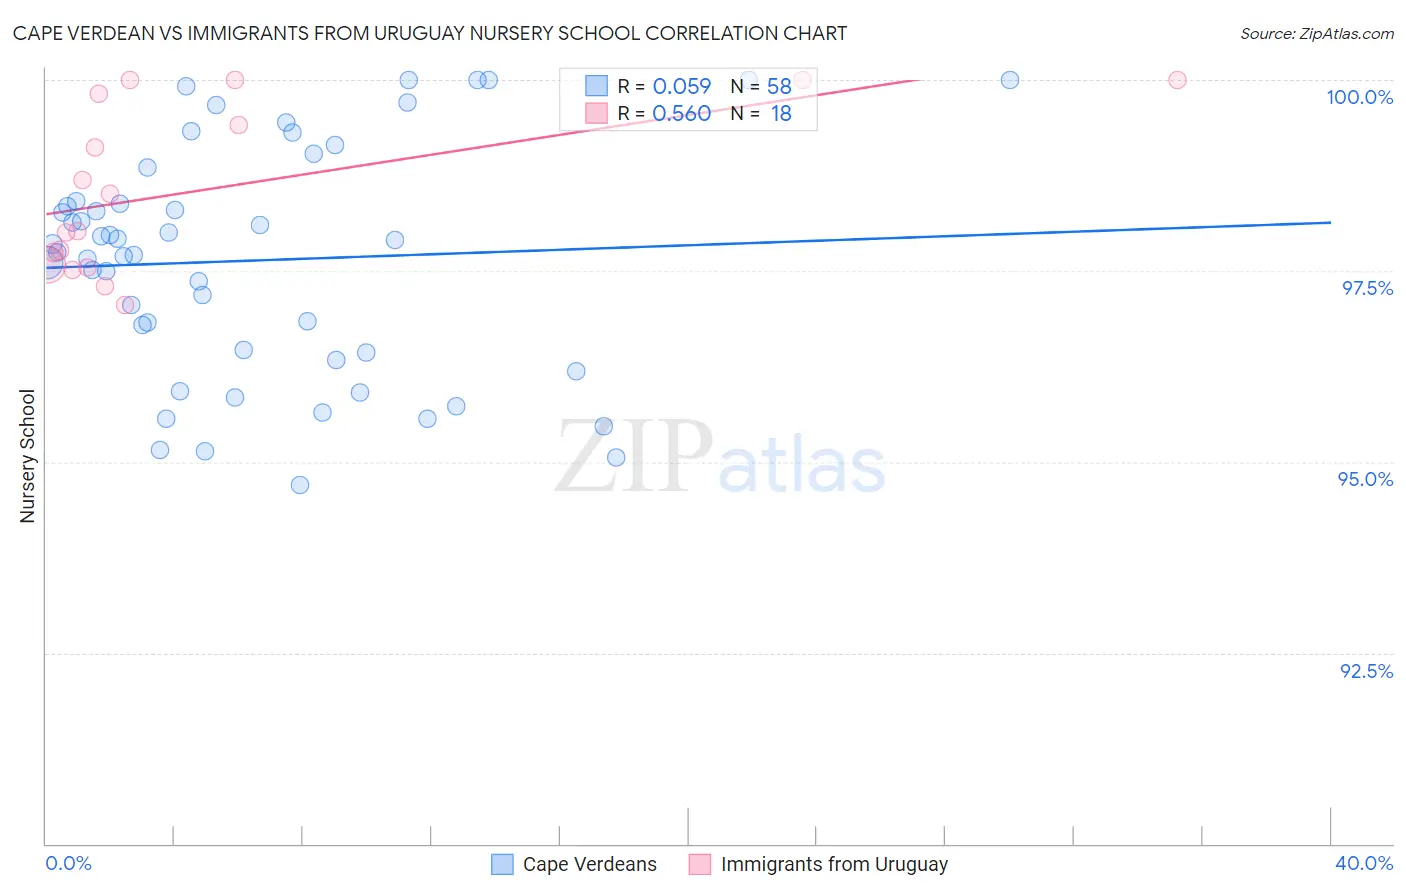
Cape Verdean vs Immigrants from Uruguay Nursery School Correlation Chart
The statistical analysis conducted on geographies consisting of 107,537,955 people shows a slight positive correlation between the proportion of Cape Verdeans and percentage of population with at least nursery school education in the United States with a correlation coefficient (R) of 0.059 and weighted average of 97.0%. Similarly, the statistical analysis conducted on geographies consisting of 133,259,667 people shows a substantial positive correlation between the proportion of Immigrants from Uruguay and percentage of population with at least nursery school education in the United States with a correlation coefficient (R) of 0.560 and weighted average of 97.7%, a difference of 0.78%.
Nursery School Correlation Summary
| Measurement | Cape Verdean | Immigrants from Uruguay |
| Minimum | 94.7% | 97.1% |
| Maximum | 100.0% | 100.0% |
| Range | 5.3% | 2.9% |
| Mean | 97.6% | 98.6% |
| Median | 97.8% | 98.3% |
| Interquartile 25% (IQ1) | 96.4% | 97.6% |
| Interquartile 75% (IQ3) | 98.4% | 99.8% |
| Interquartile Range (IQR) | 2.0% | 2.2% |
| Standard Deviation (Sample) | 1.5% | 1.1% |
| Standard Deviation (Population) | 1.5% | 1.0% |
Similar Demographics by Nursery School
Demographics Similar to Cape Verdeans by Nursery School
In terms of nursery school, the demographic groups most similar to Cape Verdeans are Immigrants from Nicaragua (96.9%, a difference of 0.0%), Immigrants from Belize (96.9%, a difference of 0.0%), Honduran (97.0%, a difference of 0.010%), Immigrants from Ecuador (96.9%, a difference of 0.010%), and Guyanese (97.0%, a difference of 0.030%).
| Demographics | Rating | Rank | Nursery School |
| Hispanics or Latinos | 0.0 /100 | #307 | Tragic 97.0% |
| Immigrants | Haiti | 0.0 /100 | #308 | Tragic 97.0% |
| Immigrants | Somalia | 0.0 /100 | #309 | Tragic 97.0% |
| Guyanese | 0.0 /100 | #310 | Tragic 97.0% |
| Immigrants | Azores | 0.0 /100 | #311 | Tragic 97.0% |
| Sri Lankans | 0.0 /100 | #312 | Tragic 97.0% |
| Hondurans | 0.0 /100 | #313 | Tragic 97.0% |
| Cape Verdeans | 0.0 /100 | #314 | Tragic 97.0% |
| Immigrants | Nicaragua | 0.0 /100 | #315 | Tragic 96.9% |
| Immigrants | Belize | 0.0 /100 | #316 | Tragic 96.9% |
| Immigrants | Ecuador | 0.0 /100 | #317 | Tragic 96.9% |
| Immigrants | Guyana | 0.0 /100 | #318 | Tragic 96.9% |
| Immigrants | Laos | 0.0 /100 | #319 | Tragic 96.9% |
| Immigrants | Burma/Myanmar | 0.0 /100 | #320 | Tragic 96.9% |
| Immigrants | Bangladesh | 0.0 /100 | #321 | Tragic 96.9% |
Demographics Similar to Immigrants from Uruguay by Nursery School
In terms of nursery school, the demographic groups most similar to Immigrants from Uruguay are Puerto Rican (97.7%, a difference of 0.010%), U.S. Virgin Islander (97.7%, a difference of 0.010%), Colombian (97.7%, a difference of 0.010%), Immigrants from Pakistan (97.7%, a difference of 0.010%), and Immigrants from Malaysia (97.7%, a difference of 0.010%).
| Demographics | Rating | Rank | Nursery School |
| Immigrants | Costa Rica | 3.5 /100 | #225 | Tragic 97.7% |
| Iraqis | 3.5 /100 | #226 | Tragic 97.7% |
| Sub-Saharan Africans | 3.2 /100 | #227 | Tragic 97.7% |
| Sudanese | 3.2 /100 | #228 | Tragic 97.7% |
| Senegalese | 3.2 /100 | #229 | Tragic 97.7% |
| Sierra Leoneans | 2.9 /100 | #230 | Tragic 97.7% |
| Puerto Ricans | 2.6 /100 | #231 | Tragic 97.7% |
| Immigrants | Uruguay | 2.3 /100 | #232 | Tragic 97.7% |
| U.S. Virgin Islanders | 2.1 /100 | #233 | Tragic 97.7% |
| Colombians | 2.1 /100 | #234 | Tragic 97.7% |
| Immigrants | Pakistan | 2.1 /100 | #235 | Tragic 97.7% |
| Immigrants | Malaysia | 1.9 /100 | #236 | Tragic 97.7% |
| Immigrants | Western Asia | 1.9 /100 | #237 | Tragic 97.7% |
| Nigerians | 1.7 /100 | #238 | Tragic 97.7% |
| Immigrants | Eastern Asia | 1.6 /100 | #239 | Tragic 97.7% |