Cambodian vs Potawatomi 4th Grade
COMPARE
Cambodian
Potawatomi
4th Grade
4th Grade Comparison
Cambodians
Potawatomi
97.7%
4TH GRADE
87.8/ 100
METRIC RATING
135th/ 347
METRIC RANK
97.9%
4TH GRADE
98.9/ 100
METRIC RATING
85th/ 347
METRIC RANK
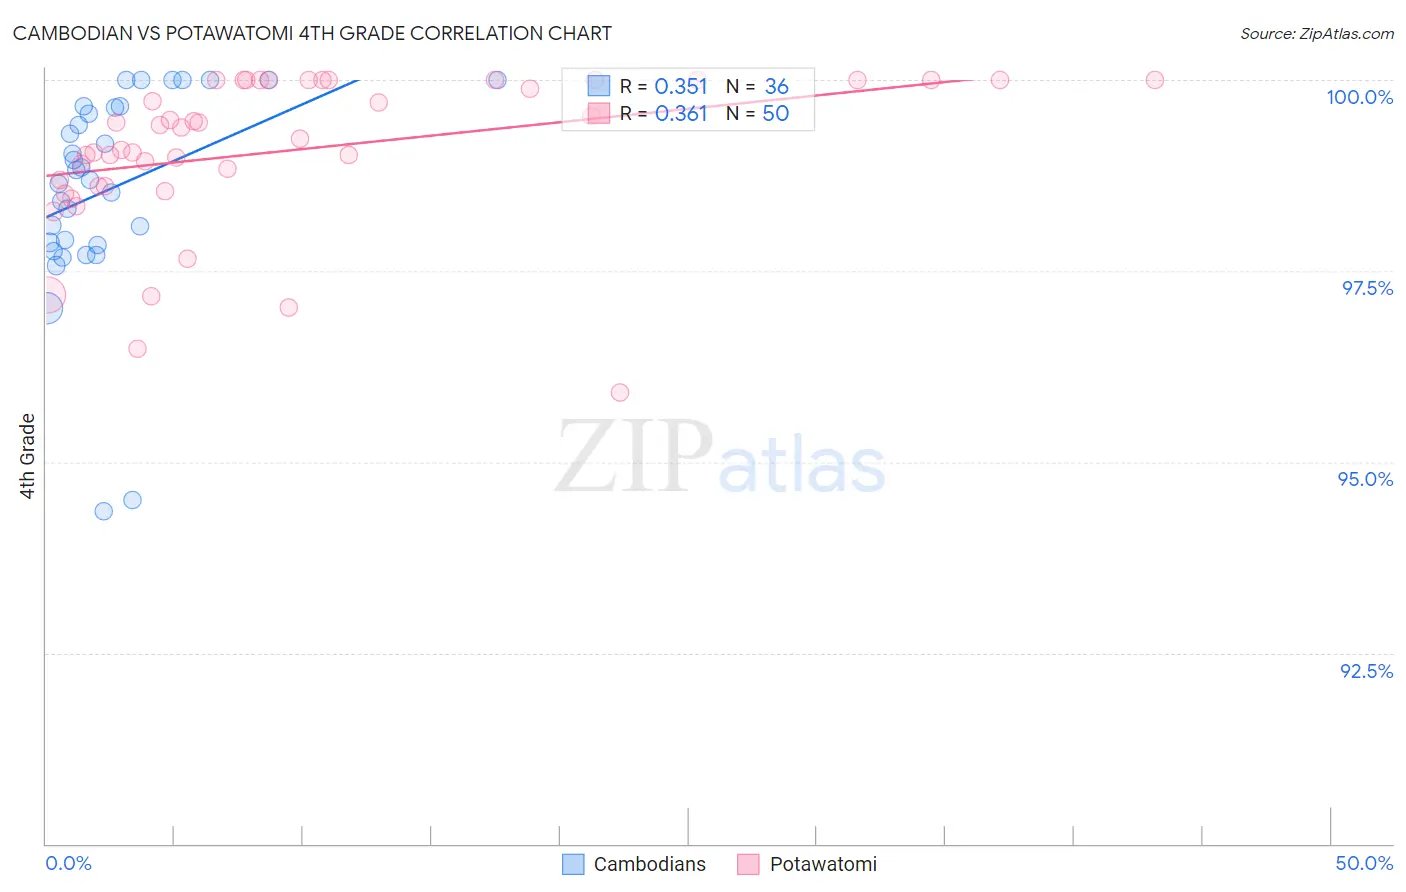
Cambodian vs Potawatomi 4th Grade Correlation Chart
The statistical analysis conducted on geographies consisting of 102,511,743 people shows a mild positive correlation between the proportion of Cambodians and percentage of population with at least 4th grade education in the United States with a correlation coefficient (R) of 0.351 and weighted average of 97.7%. Similarly, the statistical analysis conducted on geographies consisting of 117,769,196 people shows a mild positive correlation between the proportion of Potawatomi and percentage of population with at least 4th grade education in the United States with a correlation coefficient (R) of 0.361 and weighted average of 97.9%, a difference of 0.24%.
4th Grade Correlation Summary
| Measurement | Cambodian | Potawatomi |
| Minimum | 94.4% | 95.9% |
| Maximum | 100.0% | 100.0% |
| Range | 5.6% | 4.1% |
| Mean | 98.6% | 99.1% |
| Median | 98.8% | 99.3% |
| Interquartile 25% (IQ1) | 97.9% | 98.6% |
| Interquartile 75% (IQ3) | 99.6% | 100.0% |
| Interquartile Range (IQR) | 1.8% | 1.4% |
| Standard Deviation (Sample) | 1.3% | 0.99% |
| Standard Deviation (Population) | 1.3% | 0.98% |
Similar Demographics by 4th Grade
Demographics Similar to Cambodians by 4th Grade
In terms of 4th grade, the demographic groups most similar to Cambodians are Hmong (97.7%, a difference of 0.0%), Palestinian (97.7%, a difference of 0.0%), Immigrants from Hungary (97.7%, a difference of 0.010%), Israeli (97.7%, a difference of 0.010%), and Immigrants from Kuwait (97.7%, a difference of 0.020%).
| Demographics | Rating | Rank | 4th Grade |
| Pima | 92.0 /100 | #128 | Exceptional 97.7% |
| Immigrants | Bulgaria | 91.3 /100 | #129 | Exceptional 97.7% |
| Immigrants | Romania | 90.6 /100 | #130 | Exceptional 97.7% |
| Immigrants | Kuwait | 89.7 /100 | #131 | Excellent 97.7% |
| Immigrants | Hungary | 89.3 /100 | #132 | Excellent 97.7% |
| Hmong | 88.2 /100 | #133 | Excellent 97.7% |
| Palestinians | 88.1 /100 | #134 | Excellent 97.7% |
| Cambodians | 87.8 /100 | #135 | Excellent 97.7% |
| Israelis | 86.2 /100 | #136 | Excellent 97.7% |
| Immigrants | Turkey | 86.0 /100 | #137 | Excellent 97.7% |
| Blackfeet | 86.0 /100 | #138 | Excellent 97.7% |
| Seminole | 84.7 /100 | #139 | Excellent 97.7% |
| Filipinos | 84.0 /100 | #140 | Excellent 97.7% |
| Immigrants | Greece | 83.8 /100 | #141 | Excellent 97.7% |
| Immigrants | North Macedonia | 83.3 /100 | #142 | Excellent 97.7% |
Demographics Similar to Potawatomi by 4th Grade
In terms of 4th grade, the demographic groups most similar to Potawatomi are Cypriot (97.9%, a difference of 0.0%), Immigrants from Australia (97.9%, a difference of 0.0%), Immigrants from Belgium (97.9%, a difference of 0.010%), Zimbabwean (97.9%, a difference of 0.010%), and Immigrants from South Africa (97.9%, a difference of 0.010%).
| Demographics | Rating | Rank | 4th Grade |
| Immigrants | England | 99.3 /100 | #78 | Exceptional 98.0% |
| Ukrainians | 99.2 /100 | #79 | Exceptional 98.0% |
| Osage | 99.2 /100 | #80 | Exceptional 98.0% |
| Immigrants | India | 99.1 /100 | #81 | Exceptional 98.0% |
| Icelanders | 99.1 /100 | #82 | Exceptional 98.0% |
| Immigrants | Belgium | 99.0 /100 | #83 | Exceptional 97.9% |
| Cypriots | 98.9 /100 | #84 | Exceptional 97.9% |
| Potawatomi | 98.9 /100 | #85 | Exceptional 97.9% |
| Immigrants | Australia | 98.8 /100 | #86 | Exceptional 97.9% |
| Zimbabweans | 98.8 /100 | #87 | Exceptional 97.9% |
| Immigrants | South Africa | 98.8 /100 | #88 | Exceptional 97.9% |
| Delaware | 98.8 /100 | #89 | Exceptional 97.9% |
| Immigrants | Denmark | 98.7 /100 | #90 | Exceptional 97.9% |
| Immigrants | Sweden | 98.7 /100 | #91 | Exceptional 97.9% |
| Immigrants | Western Europe | 98.7 /100 | #92 | Exceptional 97.9% |