Burmese vs Slavic High School Diploma
COMPARE
Burmese
Slavic
High School Diploma
High School Diploma Comparison
Burmese
Slavs
90.8%
HIGH SCHOOL DIPLOMA
99.3/ 100
METRIC RATING
78th/ 347
METRIC RANK
91.0%
HIGH SCHOOL DIPLOMA
99.7/ 100
METRIC RATING
58th/ 347
METRIC RANK
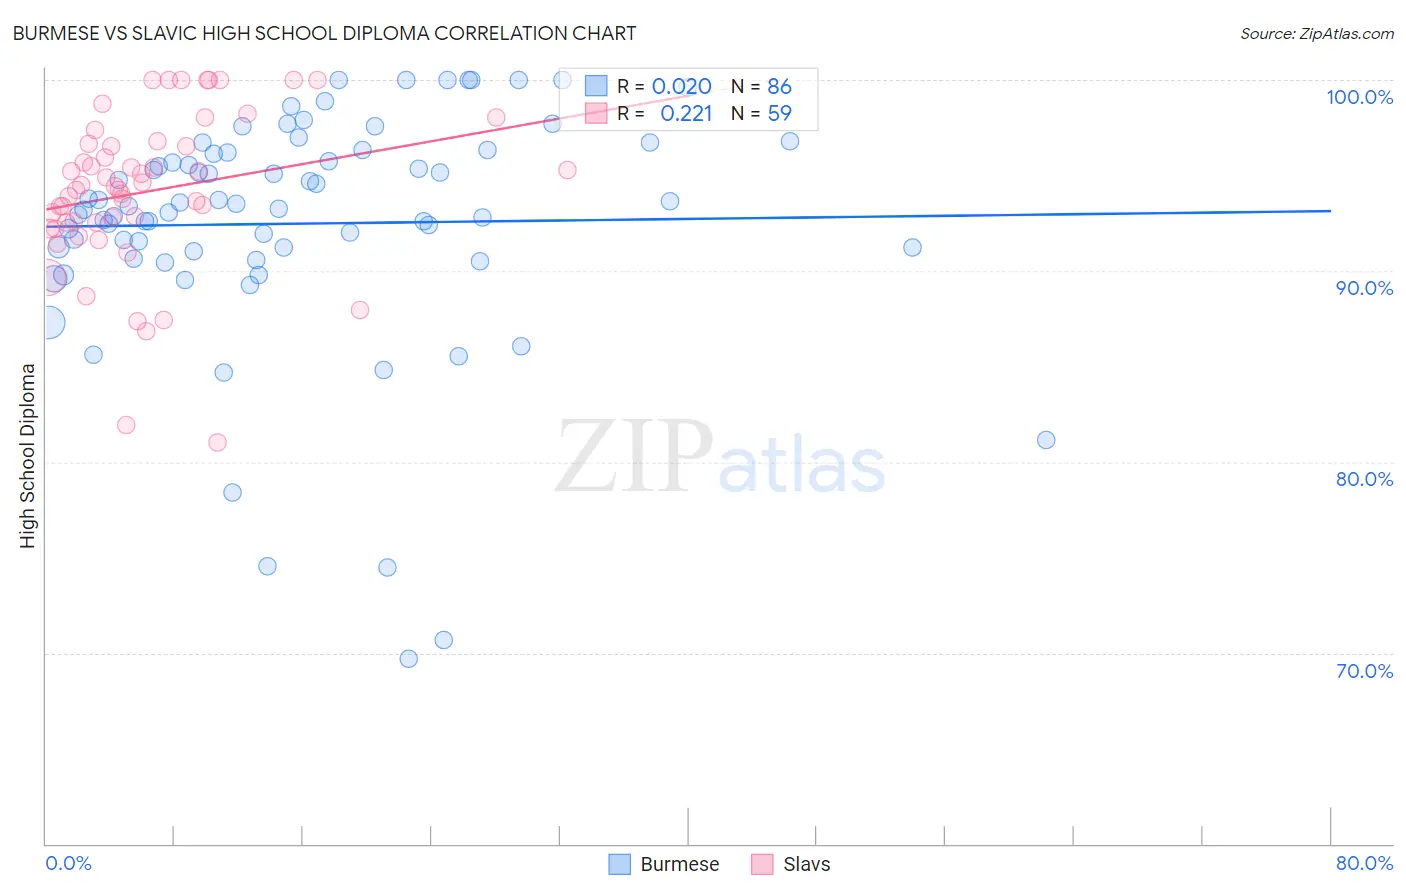
Burmese vs Slavic High School Diploma Correlation Chart
The statistical analysis conducted on geographies consisting of 465,407,978 people shows no correlation between the proportion of Burmese and percentage of population with at least high school diploma education in the United States with a correlation coefficient (R) of 0.020 and weighted average of 90.8%. Similarly, the statistical analysis conducted on geographies consisting of 270,868,354 people shows a weak positive correlation between the proportion of Slavs and percentage of population with at least high school diploma education in the United States with a correlation coefficient (R) of 0.221 and weighted average of 91.0%, a difference of 0.25%.
High School Diploma Correlation Summary
| Measurement | Burmese | Slavic |
| Minimum | 69.7% | 81.0% |
| Maximum | 100.0% | 100.0% |
| Range | 30.3% | 19.0% |
| Mean | 92.5% | 94.2% |
| Median | 93.3% | 94.5% |
| Interquartile 25% (IQ1) | 91.0% | 92.6% |
| Interquartile 75% (IQ3) | 96.2% | 96.7% |
| Interquartile Range (IQR) | 5.1% | 4.1% |
| Standard Deviation (Sample) | 6.2% | 4.2% |
| Standard Deviation (Population) | 6.1% | 4.1% |
Demographics Similar to Burmese and Slavs by High School Diploma
In terms of high school diploma, the demographic groups most similar to Burmese are Native Hawaiian (90.8%, a difference of 0.0%), Hungarian (90.8%, a difference of 0.010%), Cambodian (90.8%, a difference of 0.020%), Immigrants from Czechoslovakia (90.9%, a difference of 0.040%), and Immigrants from South Central Asia (90.9%, a difference of 0.050%). Similarly, the demographic groups most similar to Slavs are Immigrants from North America (91.0%, a difference of 0.0%), Immigrants from Japan (91.0%, a difference of 0.030%), Immigrants from Taiwan (91.0%, a difference of 0.040%), Austrian (91.0%, a difference of 0.060%), and Immigrants from Netherlands (91.0%, a difference of 0.090%).
| Demographics | Rating | Rank | High School Diploma |
| Slavs | 99.7 /100 | #58 | Exceptional 91.0% |
| Immigrants | North America | 99.7 /100 | #59 | Exceptional 91.0% |
| Immigrants | Japan | 99.6 /100 | #60 | Exceptional 91.0% |
| Immigrants | Taiwan | 99.6 /100 | #61 | Exceptional 91.0% |
| Austrians | 99.6 /100 | #62 | Exceptional 91.0% |
| Immigrants | Netherlands | 99.6 /100 | #63 | Exceptional 91.0% |
| Ukrainians | 99.6 /100 | #64 | Exceptional 91.0% |
| Immigrants | South Africa | 99.6 /100 | #65 | Exceptional 91.0% |
| French | 99.5 /100 | #66 | Exceptional 91.0% |
| Immigrants | Iran | 99.5 /100 | #67 | Exceptional 90.9% |
| Czechoslovakians | 99.5 /100 | #68 | Exceptional 90.9% |
| French Canadians | 99.5 /100 | #69 | Exceptional 90.9% |
| Immigrants | Latvia | 99.5 /100 | #70 | Exceptional 90.9% |
| Alaskan Athabascans | 99.4 /100 | #71 | Exceptional 90.9% |
| Soviet Union | 99.4 /100 | #72 | Exceptional 90.9% |
| Immigrants | South Central Asia | 99.4 /100 | #73 | Exceptional 90.9% |
| Immigrants | Czechoslovakia | 99.4 /100 | #74 | Exceptional 90.9% |
| Cambodians | 99.4 /100 | #75 | Exceptional 90.8% |
| Hungarians | 99.3 /100 | #76 | Exceptional 90.8% |
| Native Hawaiians | 99.3 /100 | #77 | Exceptional 90.8% |
| Burmese | 99.3 /100 | #78 | Exceptional 90.8% |