Bulgarian vs Immigrants from Ethiopia 12th Grade, No Diploma
COMPARE
Bulgarian
Immigrants from Ethiopia
12th Grade, No Diploma
12th Grade, No Diploma Comparison
Bulgarians
Immigrants from Ethiopia
93.5%
12TH GRADE, NO DIPLOMA
100.0/ 100
METRIC RATING
14th/ 347
METRIC RANK
90.9%
12TH GRADE, NO DIPLOMA
27.2/ 100
METRIC RATING
193rd/ 347
METRIC RANK
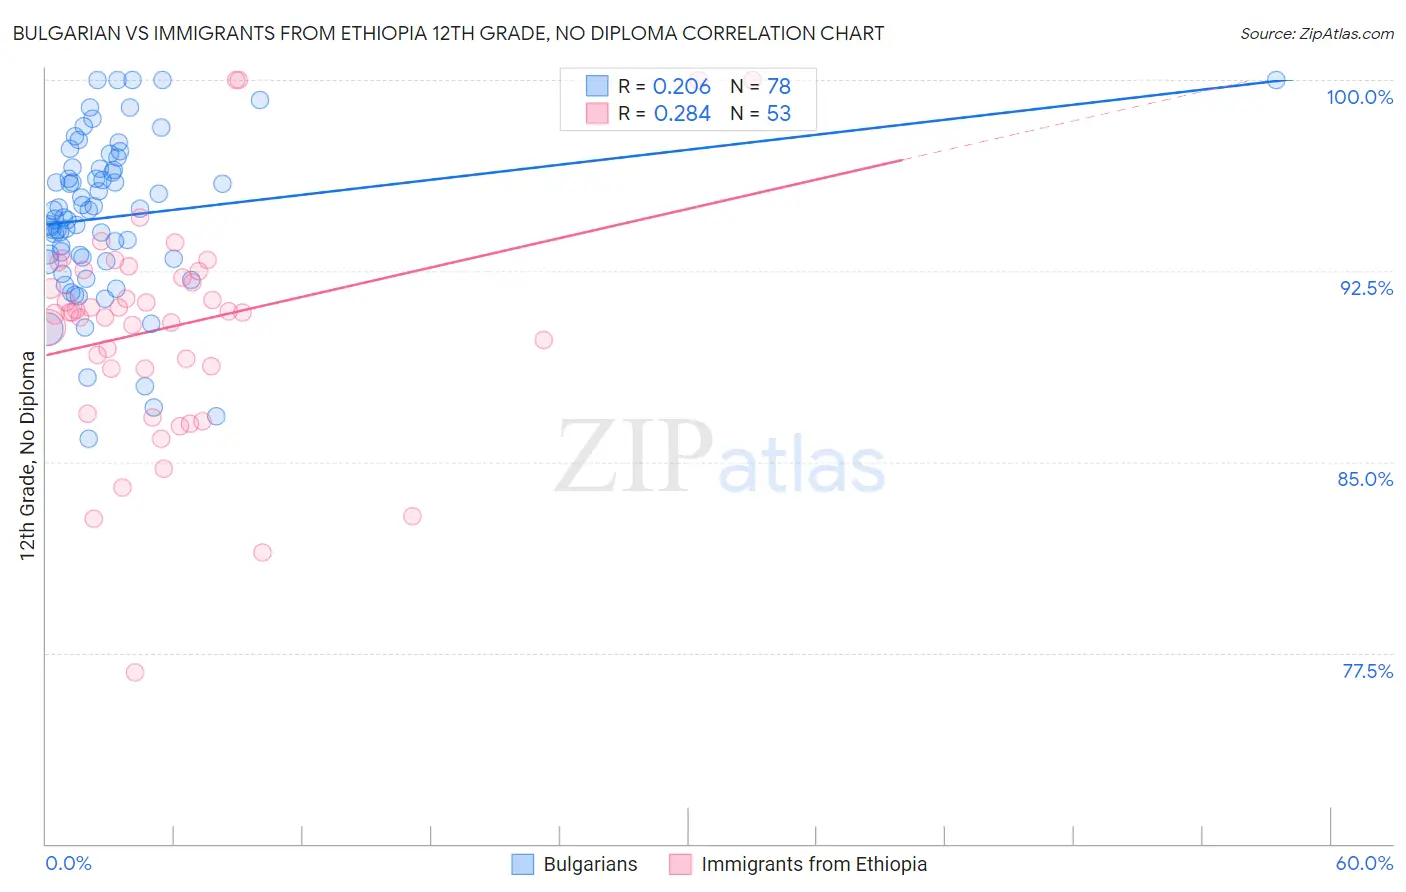
Bulgarian vs Immigrants from Ethiopia 12th Grade, No Diploma Correlation Chart
The statistical analysis conducted on geographies consisting of 205,633,404 people shows a weak positive correlation between the proportion of Bulgarians and percentage of population with at least 12th grade (no diploma) education in the United States with a correlation coefficient (R) of 0.206 and weighted average of 93.5%. Similarly, the statistical analysis conducted on geographies consisting of 211,528,629 people shows a weak positive correlation between the proportion of Immigrants from Ethiopia and percentage of population with at least 12th grade (no diploma) education in the United States with a correlation coefficient (R) of 0.284 and weighted average of 90.9%, a difference of 2.8%.
12th Grade, No Diploma Correlation Summary
| Measurement | Bulgarian | Immigrants from Ethiopia |
| Minimum | 85.9% | 76.7% |
| Maximum | 100.0% | 100.0% |
| Range | 14.1% | 23.3% |
| Mean | 94.6% | 90.3% |
| Median | 94.7% | 90.9% |
| Interquartile 25% (IQ1) | 93.0% | 88.7% |
| Interquartile 75% (IQ3) | 96.5% | 92.5% |
| Interquartile Range (IQR) | 3.5% | 3.9% |
| Standard Deviation (Sample) | 3.1% | 4.4% |
| Standard Deviation (Population) | 3.1% | 4.4% |
Similar Demographics by 12th Grade, No Diploma
Demographics Similar to Bulgarians by 12th Grade, No Diploma
In terms of 12th grade, no diploma, the demographic groups most similar to Bulgarians are Danish (93.5%, a difference of 0.020%), Eastern European (93.5%, a difference of 0.040%), Polish (93.5%, a difference of 0.050%), Finnish (93.4%, a difference of 0.090%), and Croatian (93.5%, a difference of 0.10%).
| Demographics | Rating | Rank | 12th Grade, No Diploma |
| Slovaks | 100.0 /100 | #7 | Exceptional 93.6% |
| Chinese | 100.0 /100 | #8 | Exceptional 93.6% |
| Latvians | 100.0 /100 | #9 | Exceptional 93.6% |
| Croatians | 100.0 /100 | #10 | Exceptional 93.5% |
| Poles | 100.0 /100 | #11 | Exceptional 93.5% |
| Eastern Europeans | 100.0 /100 | #12 | Exceptional 93.5% |
| Danes | 100.0 /100 | #13 | Exceptional 93.5% |
| Bulgarians | 100.0 /100 | #14 | Exceptional 93.5% |
| Finns | 100.0 /100 | #15 | Exceptional 93.4% |
| Maltese | 100.0 /100 | #16 | Exceptional 93.3% |
| Luxembourgers | 100.0 /100 | #17 | Exceptional 93.3% |
| Immigrants | Singapore | 99.9 /100 | #18 | Exceptional 93.3% |
| Germans | 99.9 /100 | #19 | Exceptional 93.3% |
| Filipinos | 99.9 /100 | #20 | Exceptional 93.2% |
| Italians | 99.9 /100 | #21 | Exceptional 93.2% |
Demographics Similar to Immigrants from Ethiopia by 12th Grade, No Diploma
In terms of 12th grade, no diploma, the demographic groups most similar to Immigrants from Ethiopia are Immigrants from Eastern Africa (90.9%, a difference of 0.010%), Immigrants from Oceania (90.9%, a difference of 0.020%), Moroccan (90.9%, a difference of 0.030%), Afghan (90.9%, a difference of 0.040%), and Korean (90.8%, a difference of 0.040%).
| Demographics | Rating | Rank | 12th Grade, No Diploma |
| Ethiopians | 33.9 /100 | #186 | Fair 91.0% |
| Potawatomi | 32.9 /100 | #187 | Fair 91.0% |
| Americans | 32.6 /100 | #188 | Fair 91.0% |
| Immigrants | Uganda | 31.6 /100 | #189 | Fair 90.9% |
| Afghans | 29.9 /100 | #190 | Fair 90.9% |
| Moroccans | 28.8 /100 | #191 | Fair 90.9% |
| Immigrants | Eastern Africa | 27.7 /100 | #192 | Fair 90.9% |
| Immigrants | Ethiopia | 27.2 /100 | #193 | Fair 90.9% |
| Immigrants | Oceania | 26.0 /100 | #194 | Fair 90.9% |
| Koreans | 24.5 /100 | #195 | Fair 90.8% |
| Panamanians | 22.8 /100 | #196 | Fair 90.8% |
| Immigrants | Sudan | 22.6 /100 | #197 | Fair 90.8% |
| Samoans | 20.4 /100 | #198 | Fair 90.8% |
| Immigrants | Southern Europe | 19.9 /100 | #199 | Poor 90.8% |
| Liberians | 19.8 /100 | #200 | Poor 90.8% |