British West Indian vs Immigrants from Ethiopia 8th Grade
COMPARE
British West Indian
Immigrants from Ethiopia
8th Grade
8th Grade Comparison
British West Indians
Immigrants from Ethiopia
94.4%
8TH GRADE
0.0/ 100
METRIC RATING
289th/ 347
METRIC RANK
95.0%
8TH GRADE
1.0/ 100
METRIC RATING
252nd/ 347
METRIC RANK
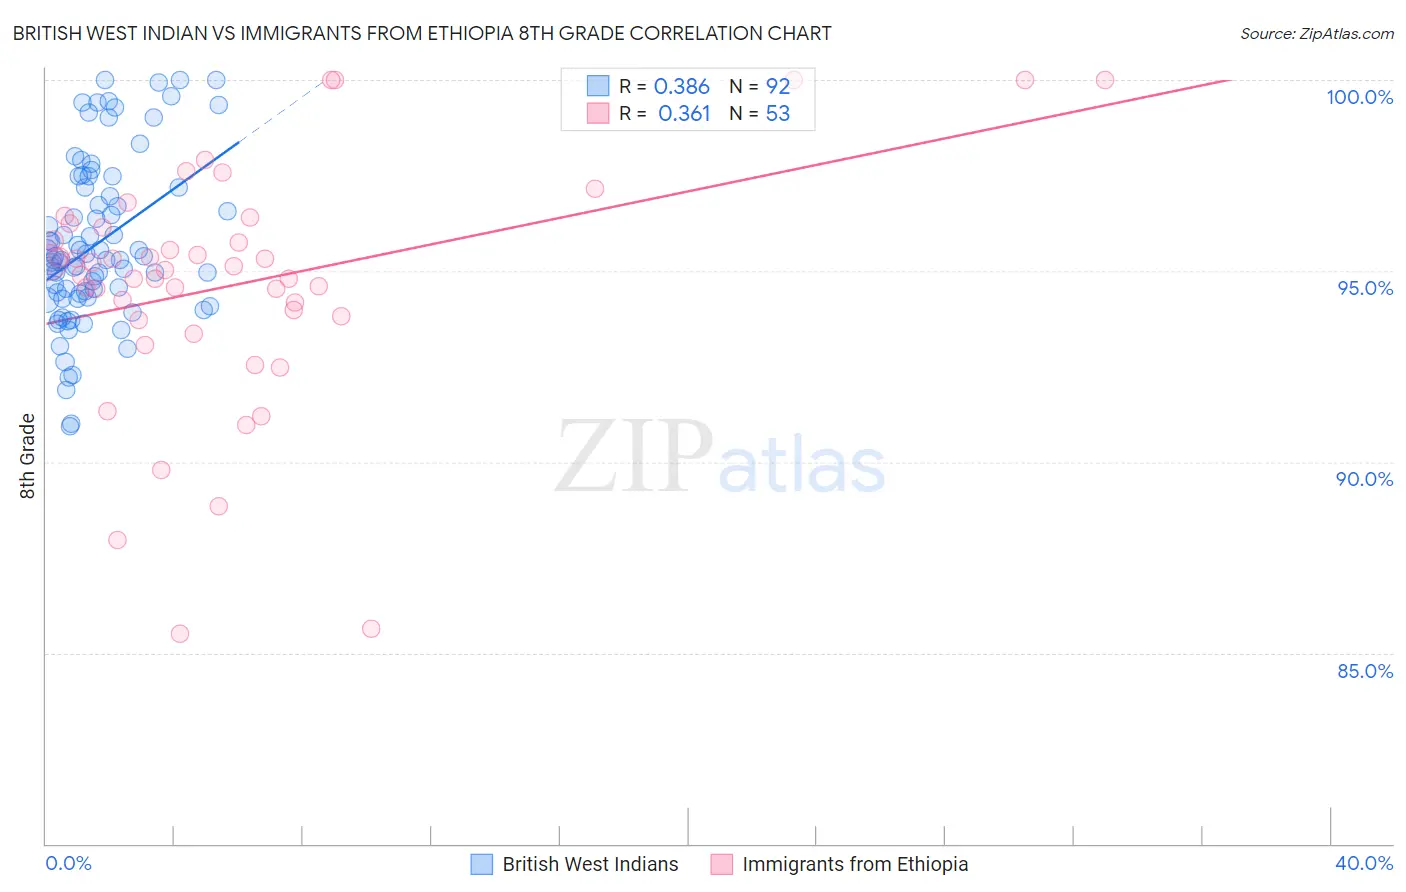
British West Indian vs Immigrants from Ethiopia 8th Grade Correlation Chart
The statistical analysis conducted on geographies consisting of 152,691,173 people shows a mild positive correlation between the proportion of British West Indians and percentage of population with at least 8th grade education in the United States with a correlation coefficient (R) of 0.386 and weighted average of 94.4%. Similarly, the statistical analysis conducted on geographies consisting of 211,528,629 people shows a mild positive correlation between the proportion of Immigrants from Ethiopia and percentage of population with at least 8th grade education in the United States with a correlation coefficient (R) of 0.361 and weighted average of 95.0%, a difference of 0.66%.
8th Grade Correlation Summary
| Measurement | British West Indian | Immigrants from Ethiopia |
| Minimum | 90.9% | 85.5% |
| Maximum | 100.0% | 100.0% |
| Range | 9.1% | 14.5% |
| Mean | 95.7% | 94.7% |
| Median | 95.3% | 95.0% |
| Interquartile 25% (IQ1) | 94.3% | 93.8% |
| Interquartile 75% (IQ3) | 97.2% | 96.2% |
| Interquartile Range (IQR) | 2.8% | 2.4% |
| Standard Deviation (Sample) | 2.1% | 3.2% |
| Standard Deviation (Population) | 2.1% | 3.1% |
Similar Demographics by 8th Grade
Demographics Similar to British West Indians by 8th Grade
In terms of 8th grade, the demographic groups most similar to British West Indians are Malaysian (94.5%, a difference of 0.060%), Immigrants from West Indies (94.3%, a difference of 0.070%), Immigrants from Grenada (94.3%, a difference of 0.080%), Immigrants from Peru (94.5%, a difference of 0.090%), and Tohono O'odham (94.5%, a difference of 0.090%).
| Demographics | Rating | Rank | 8th Grade |
| Immigrants | Eritrea | 0.1 /100 | #282 | Tragic 94.6% |
| Immigrants | St. Vincent and the Grenadines | 0.1 /100 | #283 | Tragic 94.6% |
| Immigrants | Philippines | 0.1 /100 | #284 | Tragic 94.6% |
| Immigrants | Barbados | 0.0 /100 | #285 | Tragic 94.5% |
| Immigrants | Peru | 0.0 /100 | #286 | Tragic 94.5% |
| Tohono O'odham | 0.0 /100 | #287 | Tragic 94.5% |
| Malaysians | 0.0 /100 | #288 | Tragic 94.5% |
| British West Indians | 0.0 /100 | #289 | Tragic 94.4% |
| Immigrants | West Indies | 0.0 /100 | #290 | Tragic 94.3% |
| Immigrants | Grenada | 0.0 /100 | #291 | Tragic 94.3% |
| Bangladeshis | 0.0 /100 | #292 | Tragic 94.3% |
| Yaqui | 0.0 /100 | #293 | Tragic 94.2% |
| Houma | 0.0 /100 | #294 | Tragic 94.2% |
| Fijians | 0.0 /100 | #295 | Tragic 94.2% |
| Haitians | 0.0 /100 | #296 | Tragic 94.2% |
Demographics Similar to Immigrants from Ethiopia by 8th Grade
In terms of 8th grade, the demographic groups most similar to Immigrants from Ethiopia are Bolivian (95.0%, a difference of 0.0%), Korean (95.0%, a difference of 0.010%), U.S. Virgin Islander (95.0%, a difference of 0.010%), Immigrants from China (95.0%, a difference of 0.020%), and Immigrants from Cameroon (95.0%, a difference of 0.030%).
| Demographics | Rating | Rank | 8th Grade |
| Jamaicans | 1.4 /100 | #245 | Tragic 95.1% |
| Somalis | 1.4 /100 | #246 | Tragic 95.1% |
| Immigrants | Senegal | 1.4 /100 | #247 | Tragic 95.1% |
| Uruguayans | 1.2 /100 | #248 | Tragic 95.1% |
| Immigrants | China | 1.1 /100 | #249 | Tragic 95.0% |
| Koreans | 1.1 /100 | #250 | Tragic 95.0% |
| Bolivians | 1.0 /100 | #251 | Tragic 95.0% |
| Immigrants | Ethiopia | 1.0 /100 | #252 | Tragic 95.0% |
| U.S. Virgin Islanders | 0.9 /100 | #253 | Tragic 95.0% |
| Immigrants | Cameroon | 0.8 /100 | #254 | Tragic 95.0% |
| Immigrants | Somalia | 0.7 /100 | #255 | Tragic 95.0% |
| Colombians | 0.7 /100 | #256 | Tragic 95.0% |
| Afghans | 0.6 /100 | #257 | Tragic 94.9% |
| Immigrants | Congo | 0.6 /100 | #258 | Tragic 94.9% |
| Ghanaians | 0.6 /100 | #259 | Tragic 94.9% |