British West Indian vs Colville Master's Degree
COMPARE
British West Indian
Colville
Master's Degree
Master's Degree Comparison
British West Indians
Colville
13.8%
MASTER'S DEGREE
8.8/ 100
METRIC RATING
229th/ 347
METRIC RANK
11.6%
MASTER'S DEGREE
0.1/ 100
METRIC RATING
291st/ 347
METRIC RANK
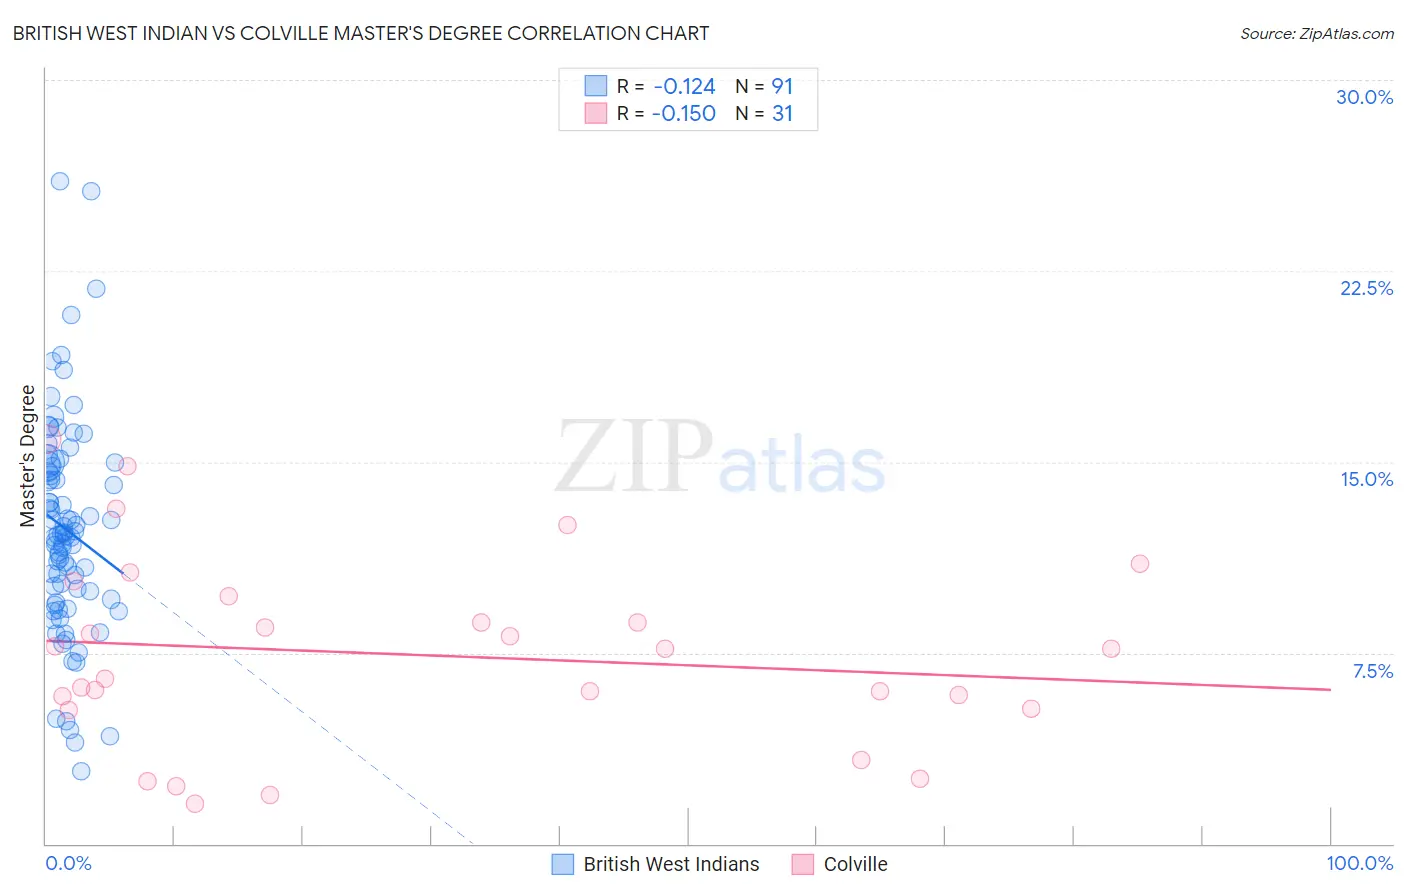
British West Indian vs Colville Master's Degree Correlation Chart
The statistical analysis conducted on geographies consisting of 152,656,458 people shows a poor negative correlation between the proportion of British West Indians and percentage of population with at least master's degree education in the United States with a correlation coefficient (R) of -0.124 and weighted average of 13.8%. Similarly, the statistical analysis conducted on geographies consisting of 34,682,548 people shows a poor negative correlation between the proportion of Colville and percentage of population with at least master's degree education in the United States with a correlation coefficient (R) of -0.150 and weighted average of 11.6%, a difference of 18.6%.
Master's Degree Correlation Summary
| Measurement | British West Indian | Colville |
| Minimum | 2.9% | 1.6% |
| Maximum | 26.0% | 15.9% |
| Range | 23.1% | 14.3% |
| Mean | 12.3% | 7.4% |
| Median | 12.2% | 7.6% |
| Interquartile 25% (IQ1) | 9.6% | 5.3% |
| Interquartile 75% (IQ3) | 14.8% | 9.7% |
| Interquartile Range (IQR) | 5.2% | 4.4% |
| Standard Deviation (Sample) | 4.2% | 3.7% |
| Standard Deviation (Population) | 4.2% | 3.6% |
Similar Demographics by Master's Degree
Demographics Similar to British West Indians by Master's Degree
In terms of master's degree, the demographic groups most similar to British West Indians are Dutch (13.8%, a difference of 0.030%), White/Caucasian (13.8%, a difference of 0.10%), Immigrants from West Indies (13.9%, a difference of 0.42%), Guyanese (13.7%, a difference of 0.58%), and Immigrants from St. Vincent and the Grenadines (13.9%, a difference of 0.86%).
| Demographics | Rating | Rank | Master's Degree |
| Ecuadorians | 12.6 /100 | #222 | Poor 14.0% |
| Immigrants | South Eastern Asia | 11.9 /100 | #223 | Poor 14.0% |
| Immigrants | Grenada | 11.8 /100 | #224 | Poor 14.0% |
| Portuguese | 11.2 /100 | #225 | Poor 13.9% |
| Immigrants | St. Vincent and the Grenadines | 11.0 /100 | #226 | Poor 13.9% |
| Immigrants | West Indies | 9.8 /100 | #227 | Tragic 13.9% |
| Whites/Caucasians | 9.1 /100 | #228 | Tragic 13.8% |
| British West Indians | 8.8 /100 | #229 | Tragic 13.8% |
| Dutch | 8.7 /100 | #230 | Tragic 13.8% |
| Guyanese | 7.6 /100 | #231 | Tragic 13.7% |
| Immigrants | Philippines | 6.0 /100 | #232 | Tragic 13.6% |
| Immigrants | Ecuador | 5.7 /100 | #233 | Tragic 13.6% |
| Immigrants | Burma/Myanmar | 5.0 /100 | #234 | Tragic 13.5% |
| German Russians | 4.5 /100 | #235 | Tragic 13.5% |
| Immigrants | Guyana | 4.4 /100 | #236 | Tragic 13.4% |
Demographics Similar to Colville by Master's Degree
In terms of master's degree, the demographic groups most similar to Colville are Immigrants from Guatemala (11.6%, a difference of 0.13%), Alaska Native (11.6%, a difference of 0.35%), Hawaiian (11.6%, a difference of 0.45%), Marshallese (11.6%, a difference of 0.60%), and Alaskan Athabascan (11.6%, a difference of 0.61%).
| Demographics | Rating | Rank | Master's Degree |
| Ottawa | 0.2 /100 | #284 | Tragic 11.9% |
| Immigrants | Nicaragua | 0.2 /100 | #285 | Tragic 11.8% |
| Aleuts | 0.1 /100 | #286 | Tragic 11.8% |
| Immigrants | Haiti | 0.1 /100 | #287 | Tragic 11.8% |
| Immigrants | Honduras | 0.1 /100 | #288 | Tragic 11.8% |
| Guatemalans | 0.1 /100 | #289 | Tragic 11.7% |
| Ute | 0.1 /100 | #290 | Tragic 11.7% |
| Colville | 0.1 /100 | #291 | Tragic 11.6% |
| Immigrants | Guatemala | 0.1 /100 | #292 | Tragic 11.6% |
| Alaska Natives | 0.1 /100 | #293 | Tragic 11.6% |
| Hawaiians | 0.1 /100 | #294 | Tragic 11.6% |
| Marshallese | 0.1 /100 | #295 | Tragic 11.6% |
| Alaskan Athabascans | 0.1 /100 | #296 | Tragic 11.6% |
| Immigrants | Yemen | 0.1 /100 | #297 | Tragic 11.6% |
| Samoans | 0.1 /100 | #298 | Tragic 11.5% |