Brazilian vs Immigrants from Dominica High School Diploma
COMPARE
Brazilian
Immigrants from Dominica
High School Diploma
High School Diploma Comparison
Brazilians
Immigrants from Dominica
89.3%
HIGH SCHOOL DIPLOMA
61.2/ 100
METRIC RATING
161st/ 347
METRIC RANK
85.2%
HIGH SCHOOL DIPLOMA
0.0/ 100
METRIC RATING
309th/ 347
METRIC RANK
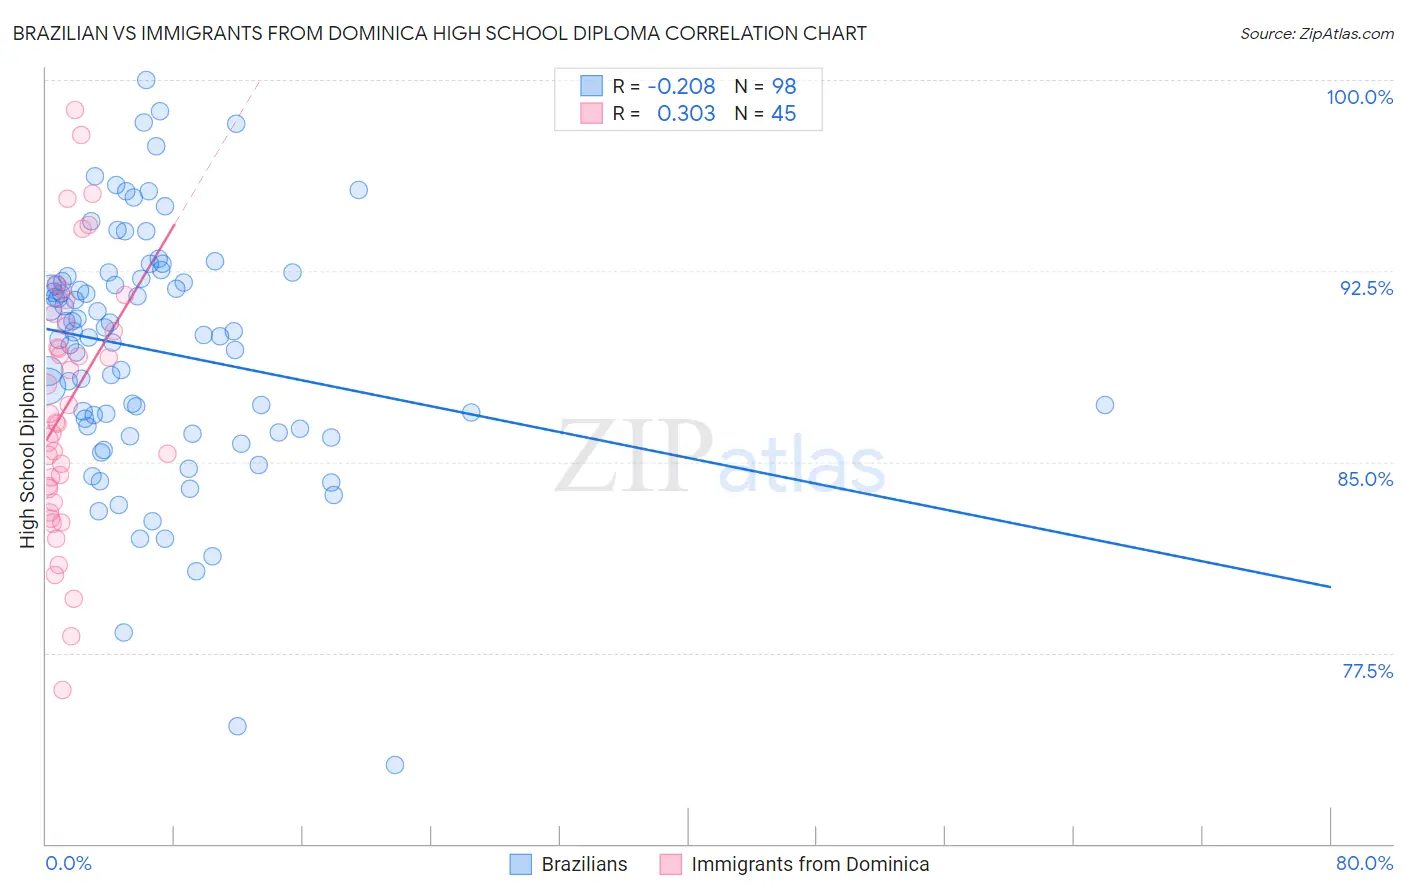
Brazilian vs Immigrants from Dominica High School Diploma Correlation Chart
The statistical analysis conducted on geographies consisting of 323,949,472 people shows a weak negative correlation between the proportion of Brazilians and percentage of population with at least high school diploma education in the United States with a correlation coefficient (R) of -0.208 and weighted average of 89.3%. Similarly, the statistical analysis conducted on geographies consisting of 83,794,115 people shows a mild positive correlation between the proportion of Immigrants from Dominica and percentage of population with at least high school diploma education in the United States with a correlation coefficient (R) of 0.303 and weighted average of 85.2%, a difference of 4.8%.
High School Diploma Correlation Summary
| Measurement | Brazilian | Immigrants from Dominica |
| Minimum | 73.1% | 76.0% |
| Maximum | 100.0% | 98.8% |
| Range | 26.9% | 22.8% |
| Mean | 89.4% | 87.2% |
| Median | 90.1% | 86.5% |
| Interquartile 25% (IQ1) | 86.3% | 83.7% |
| Interquartile 75% (IQ3) | 92.2% | 90.6% |
| Interquartile Range (IQR) | 5.9% | 6.9% |
| Standard Deviation (Sample) | 4.9% | 5.1% |
| Standard Deviation (Population) | 4.8% | 5.0% |
Similar Demographics by High School Diploma
Demographics Similar to Brazilians by High School Diploma
In terms of high school diploma, the demographic groups most similar to Brazilians are Bermudan (89.3%, a difference of 0.0%), Cree (89.3%, a difference of 0.0%), Immigrants from Nepal (89.3%, a difference of 0.0%), Immigrants from China (89.3%, a difference of 0.010%), and Laotian (89.3%, a difference of 0.010%).
| Demographics | Rating | Rank | High School Diploma |
| Alsatians | 66.8 /100 | #154 | Good 89.4% |
| Immigrants | Northern Africa | 66.4 /100 | #155 | Good 89.4% |
| Immigrants | Argentina | 65.5 /100 | #156 | Good 89.4% |
| Immigrants | Malaysia | 63.5 /100 | #157 | Good 89.3% |
| Immigrants | Pakistan | 62.5 /100 | #158 | Good 89.3% |
| Immigrants | China | 62.0 /100 | #159 | Good 89.3% |
| Laotians | 61.8 /100 | #160 | Good 89.3% |
| Brazilians | 61.2 /100 | #161 | Good 89.3% |
| Bermudans | 61.1 /100 | #162 | Good 89.3% |
| Cree | 61.1 /100 | #163 | Good 89.3% |
| Immigrants | Nepal | 61.1 /100 | #164 | Good 89.3% |
| Immigrants | Asia | 59.8 /100 | #165 | Average 89.3% |
| Immigrants | Albania | 59.4 /100 | #166 | Average 89.3% |
| Immigrants | Hong Kong | 58.6 /100 | #167 | Average 89.3% |
| Delaware | 55.8 /100 | #168 | Average 89.2% |
Demographics Similar to Immigrants from Dominica by High School Diploma
In terms of high school diploma, the demographic groups most similar to Immigrants from Dominica are Navajo (85.2%, a difference of 0.020%), Immigrants from Armenia (85.2%, a difference of 0.020%), Apache (85.1%, a difference of 0.080%), Ecuadorian (85.1%, a difference of 0.090%), and Immigrants from Guyana (85.3%, a difference of 0.11%).
| Demographics | Rating | Rank | High School Diploma |
| Immigrants | Haiti | 0.0 /100 | #302 | Tragic 85.4% |
| Cubans | 0.0 /100 | #303 | Tragic 85.4% |
| Nepalese | 0.0 /100 | #304 | Tragic 85.3% |
| Immigrants | Portugal | 0.0 /100 | #305 | Tragic 85.3% |
| Immigrants | Guyana | 0.0 /100 | #306 | Tragic 85.3% |
| Navajo | 0.0 /100 | #307 | Tragic 85.2% |
| Immigrants | Armenia | 0.0 /100 | #308 | Tragic 85.2% |
| Immigrants | Dominica | 0.0 /100 | #309 | Tragic 85.2% |
| Apache | 0.0 /100 | #310 | Tragic 85.1% |
| Ecuadorians | 0.0 /100 | #311 | Tragic 85.1% |
| Cape Verdeans | 0.0 /100 | #312 | Tragic 85.1% |
| Immigrants | Ecuador | 0.0 /100 | #313 | Tragic 84.8% |
| Yaqui | 0.0 /100 | #314 | Tragic 84.7% |
| Puerto Ricans | 0.0 /100 | #315 | Tragic 84.7% |
| Belizeans | 0.0 /100 | #316 | Tragic 84.3% |