Brazilian vs Immigrants from Costa Rica 8th Grade
COMPARE
Brazilian
Immigrants from Costa Rica
8th Grade
8th Grade Comparison
Brazilians
Immigrants from Costa Rica
95.6%
8TH GRADE
34.8/ 100
METRIC RATING
186th/ 347
METRIC RANK
94.9%
8TH GRADE
0.5/ 100
METRIC RATING
261st/ 347
METRIC RANK
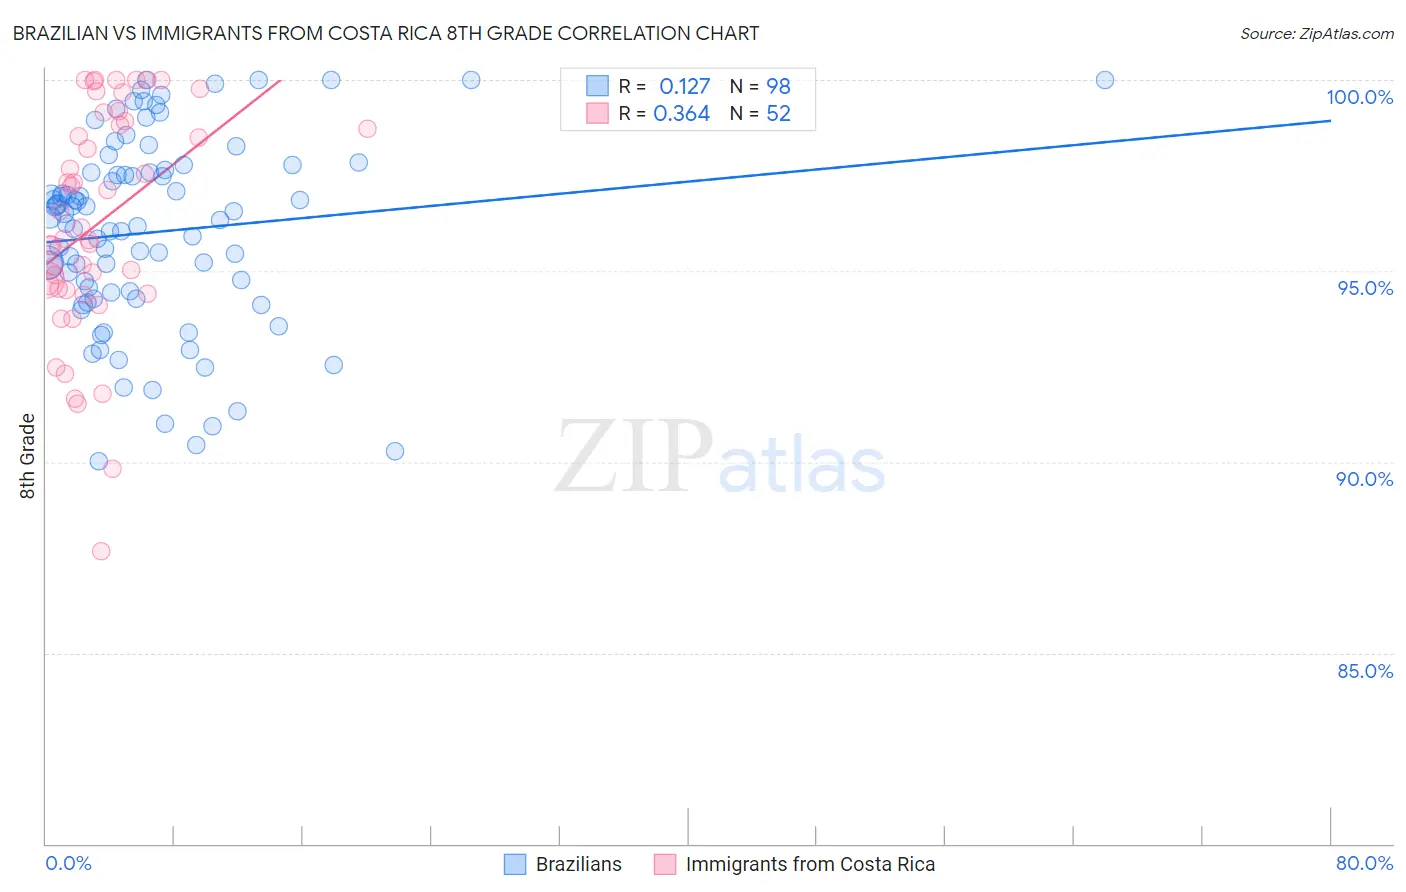
Brazilian vs Immigrants from Costa Rica 8th Grade Correlation Chart
The statistical analysis conducted on geographies consisting of 323,961,610 people shows a poor positive correlation between the proportion of Brazilians and percentage of population with at least 8th grade education in the United States with a correlation coefficient (R) of 0.127 and weighted average of 95.6%. Similarly, the statistical analysis conducted on geographies consisting of 204,277,408 people shows a mild positive correlation between the proportion of Immigrants from Costa Rica and percentage of population with at least 8th grade education in the United States with a correlation coefficient (R) of 0.364 and weighted average of 94.9%, a difference of 0.78%.
8th Grade Correlation Summary
| Measurement | Brazilian | Immigrants from Costa Rica |
| Minimum | 90.0% | 87.6% |
| Maximum | 100.0% | 100.0% |
| Range | 10.0% | 12.4% |
| Mean | 96.0% | 96.3% |
| Median | 96.4% | 96.0% |
| Interquartile 25% (IQ1) | 94.4% | 94.5% |
| Interquartile 75% (IQ3) | 97.6% | 98.9% |
| Interquartile Range (IQR) | 3.1% | 4.4% |
| Standard Deviation (Sample) | 2.5% | 3.0% |
| Standard Deviation (Population) | 2.5% | 2.9% |
Similar Demographics by 8th Grade
Demographics Similar to Brazilians by 8th Grade
In terms of 8th grade, the demographic groups most similar to Brazilians are Black/African American (95.6%, a difference of 0.0%), Immigrants from Iraq (95.6%, a difference of 0.010%), Immigrants from Uganda (95.6%, a difference of 0.010%), Sudanese (95.6%, a difference of 0.010%), and Immigrants from Egypt (95.7%, a difference of 0.020%).
| Demographics | Rating | Rank | 8th Grade |
| Immigrants | Brazil | 45.4 /100 | #179 | Average 95.7% |
| Iraqis | 40.5 /100 | #180 | Average 95.7% |
| Immigrants | Spain | 38.7 /100 | #181 | Fair 95.7% |
| Immigrants | Egypt | 37.9 /100 | #182 | Fair 95.7% |
| Immigrants | Iraq | 36.2 /100 | #183 | Fair 95.6% |
| Immigrants | Uganda | 36.0 /100 | #184 | Fair 95.6% |
| Blacks/African Americans | 34.8 /100 | #185 | Fair 95.6% |
| Brazilians | 34.8 /100 | #186 | Fair 95.6% |
| Sudanese | 33.0 /100 | #187 | Fair 95.6% |
| Liberians | 32.4 /100 | #188 | Fair 95.6% |
| Immigrants | Micronesia | 31.6 /100 | #189 | Fair 95.6% |
| Immigrants | Venezuela | 30.8 /100 | #190 | Fair 95.6% |
| Immigrants | Nepal | 30.2 /100 | #191 | Fair 95.6% |
| Pima | 28.6 /100 | #192 | Fair 95.6% |
| Panamanians | 28.4 /100 | #193 | Fair 95.6% |
Demographics Similar to Immigrants from Costa Rica by 8th Grade
In terms of 8th grade, the demographic groups most similar to Immigrants from Costa Rica are Immigrants from Nigeria (94.9%, a difference of 0.020%), Immigrants from Hong Kong (94.9%, a difference of 0.020%), South American (94.9%, a difference of 0.030%), Yuman (94.9%, a difference of 0.030%), and Immigrants from Congo (94.9%, a difference of 0.040%).
| Demographics | Rating | Rank | 8th Grade |
| Immigrants | Cameroon | 0.8 /100 | #254 | Tragic 95.0% |
| Immigrants | Somalia | 0.7 /100 | #255 | Tragic 95.0% |
| Colombians | 0.7 /100 | #256 | Tragic 95.0% |
| Afghans | 0.6 /100 | #257 | Tragic 94.9% |
| Immigrants | Congo | 0.6 /100 | #258 | Tragic 94.9% |
| Ghanaians | 0.6 /100 | #259 | Tragic 94.9% |
| Immigrants | Jamaica | 0.6 /100 | #260 | Tragic 94.9% |
| Immigrants | Costa Rica | 0.5 /100 | #261 | Tragic 94.9% |
| Immigrants | Nigeria | 0.4 /100 | #262 | Tragic 94.9% |
| Immigrants | Hong Kong | 0.4 /100 | #263 | Tragic 94.9% |
| South Americans | 0.4 /100 | #264 | Tragic 94.9% |
| Yuman | 0.4 /100 | #265 | Tragic 94.9% |
| West Indians | 0.3 /100 | #266 | Tragic 94.8% |
| Immigrants | Ghana | 0.3 /100 | #267 | Tragic 94.8% |
| Immigrants | Uruguay | 0.3 /100 | #268 | Tragic 94.8% |