Brazilian vs Immigrants from Cambodia Bachelor's Degree

COMPARE

Brazilian
Race
Ancestry
AfghanAfricanAlaska NativeAlaskan AthabascanAlbanianAleutAlsatianAmericanApacheArabArapahoArgentineanArmenianAssyrian/Chaldean/SyriacAustralianAustrianBahamianBangladeshiBarbadianBasqueBelgianBelizeanBermudanBhutaneseBlackfeetBolivianBrazilianBritishBritish West IndianBulgarianBurmeseCajunCambodianCanadianCape VerdeanCarpatho RusynCelticCentral AmericanCentral American IndianCherokeeCheyenneChickasawChileanChineseChippewaChoctawColombianColvilleComancheCosta RicanCreeCreekCroatianCrowCubanCypriotCzechCzechoslovakianDanishDelawareDominicanDutchDutch West IndianEastern EuropeanEcuadorianEgyptianEnglishEstonianEthiopianEuropeanFijianFilipinoFinnishFrenchFrench American IndianFrench CanadianGermanGerman RussianGhanaianGreekGuamanian/ChamorroGuatemalanGuyaneseHaitianHmongHonduranHopiHoumaHungarianIcelanderIndian (Asian)IndonesianInupiatIranianIraqiIrishIroquoisIsraeliItalianJamaicanJapaneseJordanianKenyanKiowaKoreanLaotianLatvianLebaneseLiberianLithuanianLumbeeLuxembourgerMacedonianMalaysianMalteseMarshalleseMenomineeMexicanMexican American IndianMongolianMoroccanNative HawaiianNavajoNepaleseNew ZealanderNicaraguanNigerianNorthern EuropeanNorwegianOkinawanOsageOttawaPaiutePakistaniPalestinianPanamanianParaguayanPennsylvania GermanPeruvianPimaPolishPortuguesePotawatomiPuebloPuerto RicanPuget Sound SalishRomanianRussianSalvadoranSamoanScandinavianScotch-IrishScottishSeminoleSenegaleseSerbianShoshoneSierra LeoneanSiouxSlavicSlovakSloveneSomaliSouth AfricanSouth AmericanSouth American IndianSoviet UnionSpaniardSpanishSpanish AmericanSpanish American IndianSri LankanSubsaharan AfricanSudaneseSwedishSwissSyrianTaiwaneseThaiTlingit-HaidaTohono O'OdhamTonganTrinidadian and TobagonianTsimshianTurkishU.S. Virgin IslanderUgandanUkrainianUruguayanUteVenezuelanVietnameseWelshWest IndianYakamaYaquiYugoslavianYumanYup'ikZimbabwean
Immigration
NonimmigrantsImmigrantsAfghanistanAfricaAlbaniaArgentinaArmeniaAsiaAustraliaAustriaBahamasBangladeshBarbadosBelarusBelgiumBelizeBoliviaBosnia and HerzegovinaBrazilBulgariaBurma/MyanmarCabo VerdeCameroonCanadaCaribbeanCentral AmericaChileChinaColombiaCongoCosta RicaCroatiaCubaCzechoslovakiaDenmarkDominicaDominican RepublicEastern AfricaEastern AsiaEastern EuropeEcuadorEgyptEl SalvadorEnglandEritreaEthiopiaEuropeFijiFranceGermanyGhanaGreeceGrenadaGuatemalaGuyanaHaitiHondurasHong KongHungaryIndiaIndonesiaIranIraqIrelandIsraelItalyJamaicaJapanJordanKazakhstanKenyaKoreaKuwaitLaosLatin AmericaLatviaLebanonLiberiaLithuaniaMalaysiaMexicoMicronesiaMiddle AfricaMoldovaMoroccoNepalNetherlandsNicaraguaNigeriaNorth AmericaNorth MacedoniaNorthern AfricaNorthern EuropeNorwayOceaniaPakistanPanamaPeruPhilippinesPolandPortugalRomaniaRussiaSaudi ArabiaScotlandSenegalSerbiaSierra LeoneSingaporeSomaliaSouth AfricaSouth AmericaSouth Central AsiaSouth Eastern AsiaSouthern EuropeSpainSri LankaSt. Vincent and the GrenadinesSudanSwedenSwitzerlandSyriaTaiwanThailandTrinidad and TobagoTurkeyUgandaUkraineUruguayUzbekistanVenezuelaVietnamWest IndiesWestern AfricaWestern AsiaWestern EuropeYemenZaireZimbabweAzores
Immigrants from Cambodia
Race
Ancestry
AfghanAfricanAlaska NativeAlaskan AthabascanAlbanianAleutAlsatianAmericanApacheArabArapahoArgentineanArmenianAssyrian/Chaldean/SyriacAustralianAustrianBahamianBangladeshiBarbadianBasqueBelgianBelizeanBermudanBhutaneseBlackfeetBolivianBritishBritish West IndianBulgarianBurmeseCajunCambodianCanadianCape VerdeanCarpatho RusynCelticCentral AmericanCentral American IndianCherokeeCheyenneChickasawChileanChineseChippewaChoctawColombianColvilleComancheCosta RicanCreeCreekCroatianCrowCubanCypriotCzechCzechoslovakianDanishDelawareDominicanDutchDutch West IndianEastern EuropeanEcuadorianEgyptianEnglishEstonianEthiopianEuropeanFijianFilipinoFinnishFrenchFrench American IndianFrench CanadianGermanGerman RussianGhanaianGreekGuamanian/ChamorroGuatemalanGuyaneseHaitianHmongHonduranHopiHoumaHungarianIcelanderIndian (Asian)IndonesianInupiatIranianIraqiIrishIroquoisIsraeliItalianJamaicanJapaneseJordanianKenyanKiowaKoreanLaotianLatvianLebaneseLiberianLithuanianLumbeeLuxembourgerMacedonianMalaysianMalteseMarshalleseMenomineeMexicanMexican American IndianMongolianMoroccanNative HawaiianNavajoNepaleseNew ZealanderNicaraguanNigerianNorthern EuropeanNorwegianOkinawanOsageOttawaPaiutePakistaniPalestinianPanamanianParaguayanPennsylvania GermanPeruvianPimaPolishPortuguesePotawatomiPuebloPuerto RicanPuget Sound SalishRomanianRussianSalvadoranSamoanScandinavianScotch-IrishScottishSeminoleSenegaleseSerbianShoshoneSierra LeoneanSiouxSlavicSlovakSloveneSomaliSouth AfricanSouth AmericanSouth American IndianSoviet UnionSpaniardSpanishSpanish AmericanSpanish American IndianSri LankanSubsaharan AfricanSudaneseSwedishSwissSyrianTaiwaneseThaiTlingit-HaidaTohono O'OdhamTonganTrinidadian and TobagonianTsimshianTurkishU.S. Virgin IslanderUgandanUkrainianUruguayanUteVenezuelanVietnameseWelshWest IndianYakamaYaquiYugoslavianYumanYup'ikZimbabwean
Immigration
NonimmigrantsImmigrantsAfghanistanAfricaAlbaniaArgentinaArmeniaAsiaAustraliaAustriaBahamasBangladeshBarbadosBelarusBelgiumBelizeBoliviaBosnia and HerzegovinaBrazilBulgariaBurma/MyanmarCabo VerdeCambodiaCameroonCanadaCaribbeanCentral AmericaChileChinaColombiaCongoCosta RicaCroatiaCubaCzechoslovakiaDenmarkDominicaDominican RepublicEastern AfricaEastern AsiaEastern EuropeEcuadorEgyptEl SalvadorEnglandEritreaEthiopiaEuropeFijiFranceGermanyGhanaGreeceGrenadaGuatemalaGuyanaHaitiHondurasHong KongHungaryIndiaIndonesiaIranIraqIrelandIsraelItalyJamaicaJapanJordanKazakhstanKenyaKoreaKuwaitLaosLatin AmericaLatviaLebanonLiberiaLithuaniaMalaysiaMexicoMicronesiaMiddle AfricaMoldovaMoroccoNepalNetherlandsNicaraguaNigeriaNorth AmericaNorth MacedoniaNorthern AfricaNorthern EuropeNorwayOceaniaPakistanPanamaPeruPhilippinesPolandPortugalRomaniaRussiaSaudi ArabiaScotlandSenegalSerbiaSierra LeoneSingaporeSomaliaSouth AfricaSouth AmericaSouth Central AsiaSouth Eastern AsiaSouthern EuropeSpainSri LankaSt. Vincent and the GrenadinesSudanSwedenSwitzerlandSyriaTaiwanThailandTrinidad and TobagoTurkeyUgandaUkraineUruguayUzbekistanVenezuelaVietnamWest IndiesWestern AfricaWestern AsiaWestern EuropeYemenZaireZimbabweAzores
Bachelor's Degree
Income
Poverty
Unemployment
Labor Participation
Family Structure
Vehicle Availability
Education Level
Disability

Bachelor's Degree Comparison

Brazilians

Immigrants from Cambodia

Exceptional
Tragic
40.8%
BACHELOR'S DEGREE
96.3/ 100
METRIC RATING
113th/ 347
METRIC RANK
34.2%
BACHELOR'S DEGREE
1.9/ 100
METRIC RATING
241st/ 347
METRIC RANK

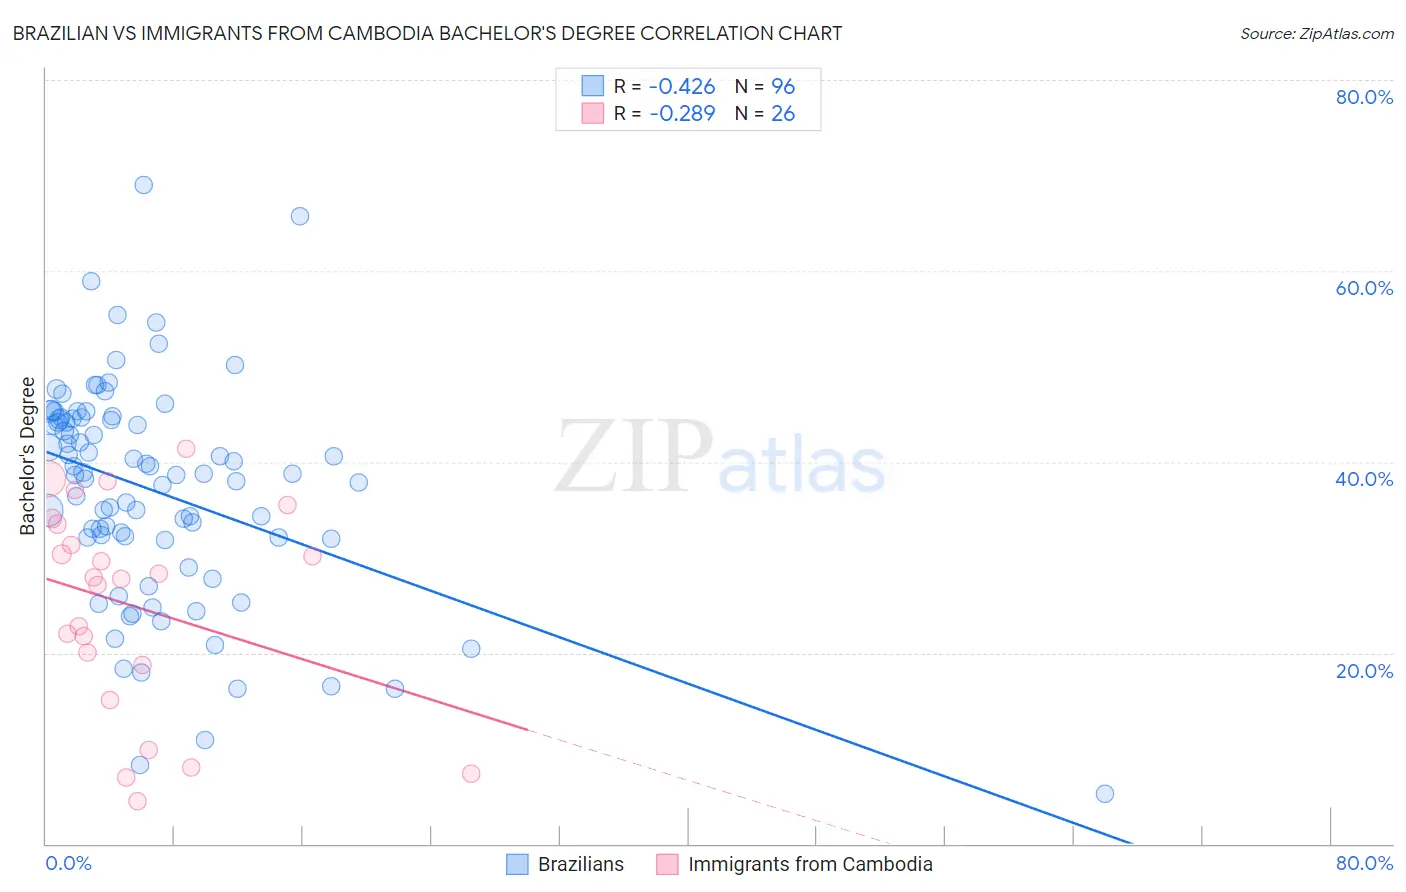
Brazilian vs Immigrants from Cambodia Bachelor's Degree Correlation Chart

The statistical analysis conducted on geographies consisting of 323,923,782 people shows a moderate negative correlation between the proportion of Brazilians and percentage of population with at least bachelor's degree education in the United States with a correlation coefficient (R) of -0.426 and weighted average of 40.8%. Similarly, the statistical analysis conducted on geographies consisting of 205,152,160 people shows a weak negative correlation between the proportion of Immigrants from Cambodia and percentage of population with at least bachelor's degree education in the United States with a correlation coefficient (R) of -0.289 and weighted average of 34.2%, a difference of 19.4%.
Brazilian vs Immigrants from Cambodia Bachelor's Degree

Bachelor's Degree Correlation Summary

MeasurementBrazilianImmigrants from Cambodia
Minimum5.3%4.5%
Maximum69.0%41.4%
Range63.7%36.9%
Mean36.9%24.9%
Median38.6%27.9%
Interquartile 25% (IQ1)32.0%18.8%
Interquartile 75% (IQ3)44.5%33.5%
Interquartile Range (IQR)12.5%14.7%
Standard Deviation (Sample)11.5%10.8%
Standard Deviation (Population)11.4%10.6%

Similar Demographics by Bachelor's Degree

Demographics Similar to Brazilians by Bachelor's Degree

In terms of bachelor's degree, the demographic groups most similar to Brazilians are Afghan (40.8%, a difference of 0.030%), Ugandan (40.8%, a difference of 0.040%), Immigrants from Chile (40.8%, a difference of 0.090%), Albanian (40.9%, a difference of 0.14%), and Arab (40.9%, a difference of 0.21%).
DemographicsRating | RankBachelor's Degree
Alsatians
97.0
/100
|
#106
Exceptional
41.0%
Northern Europeans
96.8
/100
|
#107
Exceptional
41.0%
Ukrainians
96.6
/100
|
#108
Exceptional
40.9%
Arabs
96.6
/100
|
#109
Exceptional
40.9%
Albanians
96.5
/100
|
#110
Exceptional
40.9%
Immigrants | Chile
96.4
/100
|
#111
Exceptional
40.8%
Ugandans
96.3
/100
|
#112
Exceptional
40.8%
Brazilians
96.3
/100
|
#113
Exceptional
40.8%
Afghans
96.2
/100
|
#114
Exceptional
40.8%
Palestinians
95.8
/100
|
#115
Exceptional
40.7%
Immigrants | Uganda
95.7
/100
|
#116
Exceptional
40.7%
Austrians
95.5
/100
|
#117
Exceptional
40.6%
Croatians
95.5
/100
|
#118
Exceptional
40.6%
Immigrants | Syria
94.9
/100
|
#119
Exceptional
40.5%
Venezuelans
94.7
/100
|
#120
Exceptional
40.5%

Demographics Similar to Immigrants from Cambodia by Bachelor's Degree

In terms of bachelor's degree, the demographic groups most similar to Immigrants from Cambodia are Nonimmigrants (34.2%, a difference of 0.060%), Tongan (34.3%, a difference of 0.26%), Immigrants from Guyana (33.9%, a difference of 0.71%), British West Indian (34.5%, a difference of 0.80%), and Guyanese (34.5%, a difference of 0.82%).
DemographicsRating | RankBachelor's Degree
Guamanians/Chamorros
3.0
/100
|
#234
Tragic
34.6%
Immigrants | West Indies
2.9
/100
|
#235
Tragic
34.6%
Liberians
2.8
/100
|
#236
Tragic
34.6%
Tlingit-Haida
2.8
/100
|
#237
Tragic
34.6%
Guyanese
2.5
/100
|
#238
Tragic
34.5%
British West Indians
2.5
/100
|
#239
Tragic
34.5%
Tongans
2.0
/100
|
#240
Tragic
34.3%
Immigrants | Cambodia
1.9
/100
|
#241
Tragic
34.2%
Immigrants | Nonimmigrants
1.8
/100
|
#242
Tragic
34.2%
Immigrants | Guyana
1.4
/100
|
#243
Tragic
33.9%
Delaware
1.2
/100
|
#244
Tragic
33.8%
Immigrants | Fiji
1.2
/100
|
#245
Tragic
33.7%
Jamaicans
1.0
/100
|
#246
Tragic
33.6%
Immigrants | Congo
1.0
/100
|
#247
Tragic
33.6%
Cree
1.0
/100
|
#248
Tragic
33.6%