Brazilian vs Arab 11th Grade
COMPARE
Brazilian
Arab
11th Grade
11th Grade Comparison
Brazilians
Arabs
92.8%
11TH GRADE
73.9/ 100
METRIC RATING
153rd/ 347
METRIC RANK
92.9%
11TH GRADE
85.4/ 100
METRIC RATING
137th/ 347
METRIC RANK
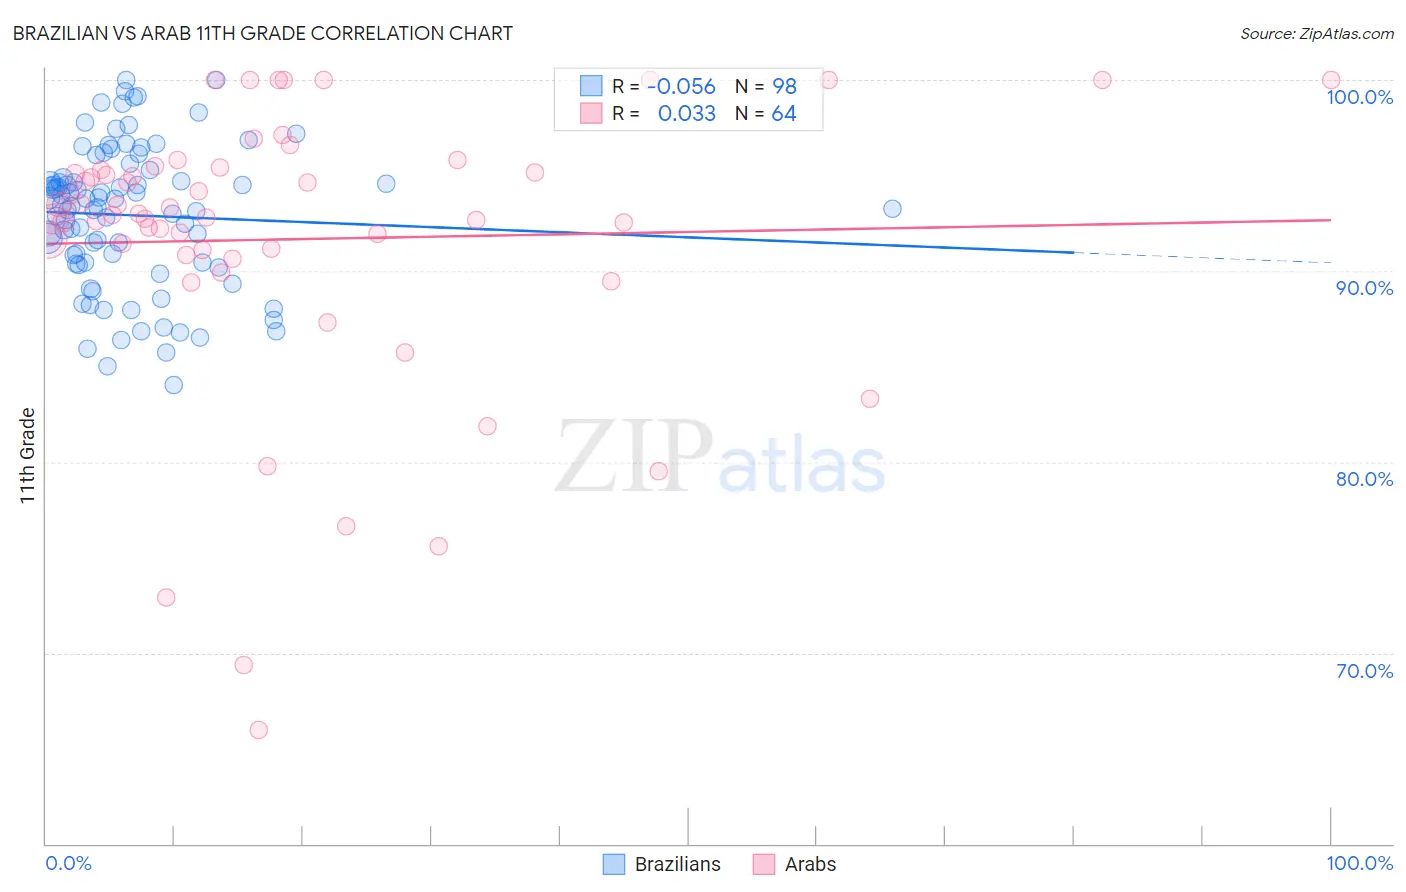
Brazilian vs Arab 11th Grade Correlation Chart
The statistical analysis conducted on geographies consisting of 323,900,771 people shows a slight negative correlation between the proportion of Brazilians and percentage of population with at least 11th grade education in the United States with a correlation coefficient (R) of -0.056 and weighted average of 92.8%. Similarly, the statistical analysis conducted on geographies consisting of 486,870,847 people shows no correlation between the proportion of Arabs and percentage of population with at least 11th grade education in the United States with a correlation coefficient (R) of 0.033 and weighted average of 92.9%, a difference of 0.18%.
11th Grade Correlation Summary
| Measurement | Brazilian | Arab |
| Minimum | 84.0% | 66.0% |
| Maximum | 100.0% | 100.0% |
| Range | 16.0% | 34.0% |
| Mean | 92.9% | 91.7% |
| Median | 93.4% | 93.0% |
| Interquartile 25% (IQ1) | 90.4% | 91.0% |
| Interquartile 75% (IQ3) | 94.9% | 95.3% |
| Interquartile Range (IQR) | 4.5% | 4.4% |
| Standard Deviation (Sample) | 3.7% | 7.4% |
| Standard Deviation (Population) | 3.7% | 7.3% |
Demographics Similar to Brazilians and Arabs by 11th Grade
In terms of 11th grade, the demographic groups most similar to Brazilians are Potawatomi (92.8%, a difference of 0.0%), Iraqi (92.8%, a difference of 0.0%), Osage (92.7%, a difference of 0.010%), Argentinean (92.7%, a difference of 0.010%), and Immigrants from Egypt (92.8%, a difference of 0.050%). Similarly, the demographic groups most similar to Arabs are Cree (92.9%, a difference of 0.010%), Immigrants from Brazil (92.9%, a difference of 0.010%), Immigrants from Italy (92.9%, a difference of 0.020%), Crow (92.9%, a difference of 0.030%), and Venezuelan (92.9%, a difference of 0.040%).
| Demographics | Rating | Rank | 11th Grade |
| Immigrants | Italy | 86.6 /100 | #135 | Excellent 92.9% |
| Cree | 85.9 /100 | #136 | Excellent 92.9% |
| Arabs | 85.4 /100 | #137 | Excellent 92.9% |
| Immigrants | Brazil | 85.1 /100 | #138 | Excellent 92.9% |
| Crow | 84.1 /100 | #139 | Excellent 92.9% |
| Venezuelans | 83.4 /100 | #140 | Excellent 92.9% |
| Chileans | 83.0 /100 | #141 | Excellent 92.9% |
| Kenyans | 82.0 /100 | #142 | Excellent 92.9% |
| Ugandans | 81.4 /100 | #143 | Excellent 92.9% |
| Assyrians/Chaldeans/Syriacs | 80.5 /100 | #144 | Excellent 92.8% |
| Pakistanis | 79.6 /100 | #145 | Good 92.8% |
| Iroquois | 79.1 /100 | #146 | Good 92.8% |
| Immigrants | Kenya | 78.7 /100 | #147 | Good 92.8% |
| Hmong | 78.6 /100 | #148 | Good 92.8% |
| Immigrants | Poland | 78.5 /100 | #149 | Good 92.8% |
| Immigrants | Egypt | 77.5 /100 | #150 | Good 92.8% |
| Potawatomi | 74.3 /100 | #151 | Good 92.8% |
| Iraqis | 74.2 /100 | #152 | Good 92.8% |
| Brazilians | 73.9 /100 | #153 | Good 92.8% |
| Osage | 73.4 /100 | #154 | Good 92.7% |
| Argentineans | 73.4 /100 | #155 | Good 92.7% |