Bolivian vs Immigrants from Syria 1st Grade
COMPARE
Bolivian
Immigrants from Syria
1st Grade
1st Grade Comparison
Bolivians
Immigrants from Syria
97.6%
1ST GRADE
1.2/ 100
METRIC RATING
243rd/ 347
METRIC RANK
97.7%
1ST GRADE
4.2/ 100
METRIC RATING
222nd/ 347
METRIC RANK
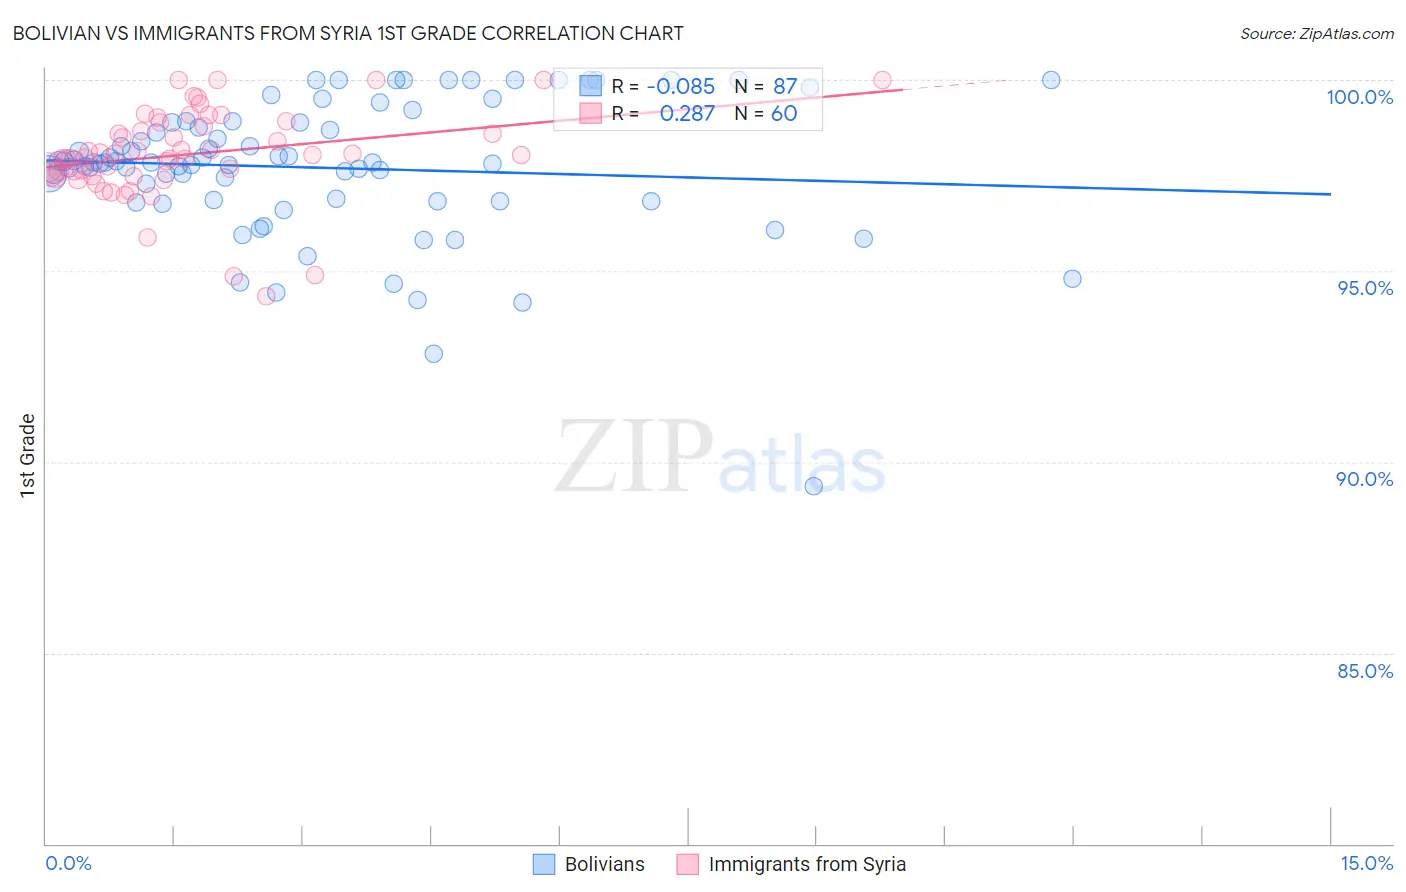
Bolivian vs Immigrants from Syria 1st Grade Correlation Chart
The statistical analysis conducted on geographies consisting of 184,667,361 people shows a slight negative correlation between the proportion of Bolivians and percentage of population with at least 1st grade education in the United States with a correlation coefficient (R) of -0.085 and weighted average of 97.6%. Similarly, the statistical analysis conducted on geographies consisting of 174,108,374 people shows a weak positive correlation between the proportion of Immigrants from Syria and percentage of population with at least 1st grade education in the United States with a correlation coefficient (R) of 0.287 and weighted average of 97.7%, a difference of 0.10%.
1st Grade Correlation Summary
| Measurement | Bolivian | Immigrants from Syria |
| Minimum | 89.3% | 94.3% |
| Maximum | 100.0% | 100.0% |
| Range | 10.7% | 5.7% |
| Mean | 97.7% | 98.1% |
| Median | 97.8% | 98.0% |
| Interquartile 25% (IQ1) | 96.8% | 97.5% |
| Interquartile 75% (IQ3) | 98.9% | 98.8% |
| Interquartile Range (IQR) | 2.0% | 1.3% |
| Standard Deviation (Sample) | 1.8% | 1.2% |
| Standard Deviation (Population) | 1.8% | 1.2% |
Similar Demographics by 1st Grade
Demographics Similar to Bolivians by 1st Grade
In terms of 1st grade, the demographic groups most similar to Bolivians are Immigrants from Indonesia (97.6%, a difference of 0.0%), Liberian (97.6%, a difference of 0.010%), Asian (97.6%, a difference of 0.010%), South American (97.6%, a difference of 0.010%), and Immigrants from Eastern Africa (97.6%, a difference of 0.010%).
| Demographics | Rating | Rank | 1st Grade |
| Immigrants | Western Asia | 2.1 /100 | #236 | Tragic 97.6% |
| U.S. Virgin Islanders | 1.9 /100 | #237 | Tragic 97.6% |
| Nigerians | 1.8 /100 | #238 | Tragic 97.6% |
| Immigrants | Eastern Asia | 1.6 /100 | #239 | Tragic 97.6% |
| Koreans | 1.5 /100 | #240 | Tragic 97.6% |
| Liberians | 1.4 /100 | #241 | Tragic 97.6% |
| Immigrants | Indonesia | 1.2 /100 | #242 | Tragic 97.6% |
| Bolivians | 1.2 /100 | #243 | Tragic 97.6% |
| Asians | 1.1 /100 | #244 | Tragic 97.6% |
| South Americans | 1.1 /100 | #245 | Tragic 97.6% |
| Immigrants | Eastern Africa | 1.0 /100 | #246 | Tragic 97.6% |
| Peruvians | 1.0 /100 | #247 | Tragic 97.6% |
| Immigrants | Middle Africa | 1.0 /100 | #248 | Tragic 97.6% |
| Immigrants | Senegal | 1.0 /100 | #249 | Tragic 97.6% |
| Ethiopians | 0.9 /100 | #250 | Tragic 97.6% |
Demographics Similar to Immigrants from Syria by 1st Grade
In terms of 1st grade, the demographic groups most similar to Immigrants from Syria are Immigrants from Sudan (97.7%, a difference of 0.0%), Immigrants from Zaire (97.7%, a difference of 0.0%), Iraqi (97.7%, a difference of 0.0%), Immigrants from Nepal (97.7%, a difference of 0.0%), and Tongan (97.7%, a difference of 0.010%).
| Demographics | Rating | Rank | 1st Grade |
| Bahamians | 7.5 /100 | #215 | Tragic 97.7% |
| Uruguayans | 7.4 /100 | #216 | Tragic 97.7% |
| Samoans | 6.8 /100 | #217 | Tragic 97.7% |
| Immigrants | Morocco | 5.3 /100 | #218 | Tragic 97.7% |
| Immigrants | Panama | 5.2 /100 | #219 | Tragic 97.7% |
| Tongans | 4.6 /100 | #220 | Tragic 97.7% |
| Immigrants | Sudan | 4.3 /100 | #221 | Tragic 97.7% |
| Immigrants | Syria | 4.2 /100 | #222 | Tragic 97.7% |
| Immigrants | Zaire | 4.1 /100 | #223 | Tragic 97.7% |
| Iraqis | 4.0 /100 | #224 | Tragic 97.7% |
| Immigrants | Nepal | 4.0 /100 | #225 | Tragic 97.7% |
| Sudanese | 3.7 /100 | #226 | Tragic 97.7% |
| Sierra Leoneans | 3.6 /100 | #227 | Tragic 97.7% |
| Sub-Saharan Africans | 3.6 /100 | #228 | Tragic 97.7% |
| Immigrants | Costa Rica | 3.5 /100 | #229 | Tragic 97.7% |