Black/African American vs Immigrants from Costa Rica Associate's Degree
COMPARE
Black/African American
Immigrants from Costa Rica
Associate's Degree
Associate's Degree Comparison
Blacks/African Americans
Immigrants from Costa Rica
39.1%
ASSOCIATE'S DEGREE
0.0/ 100
METRIC RATING
292nd/ 347
METRIC RANK
45.0%
ASSOCIATE'S DEGREE
16.7/ 100
METRIC RATING
209th/ 347
METRIC RANK
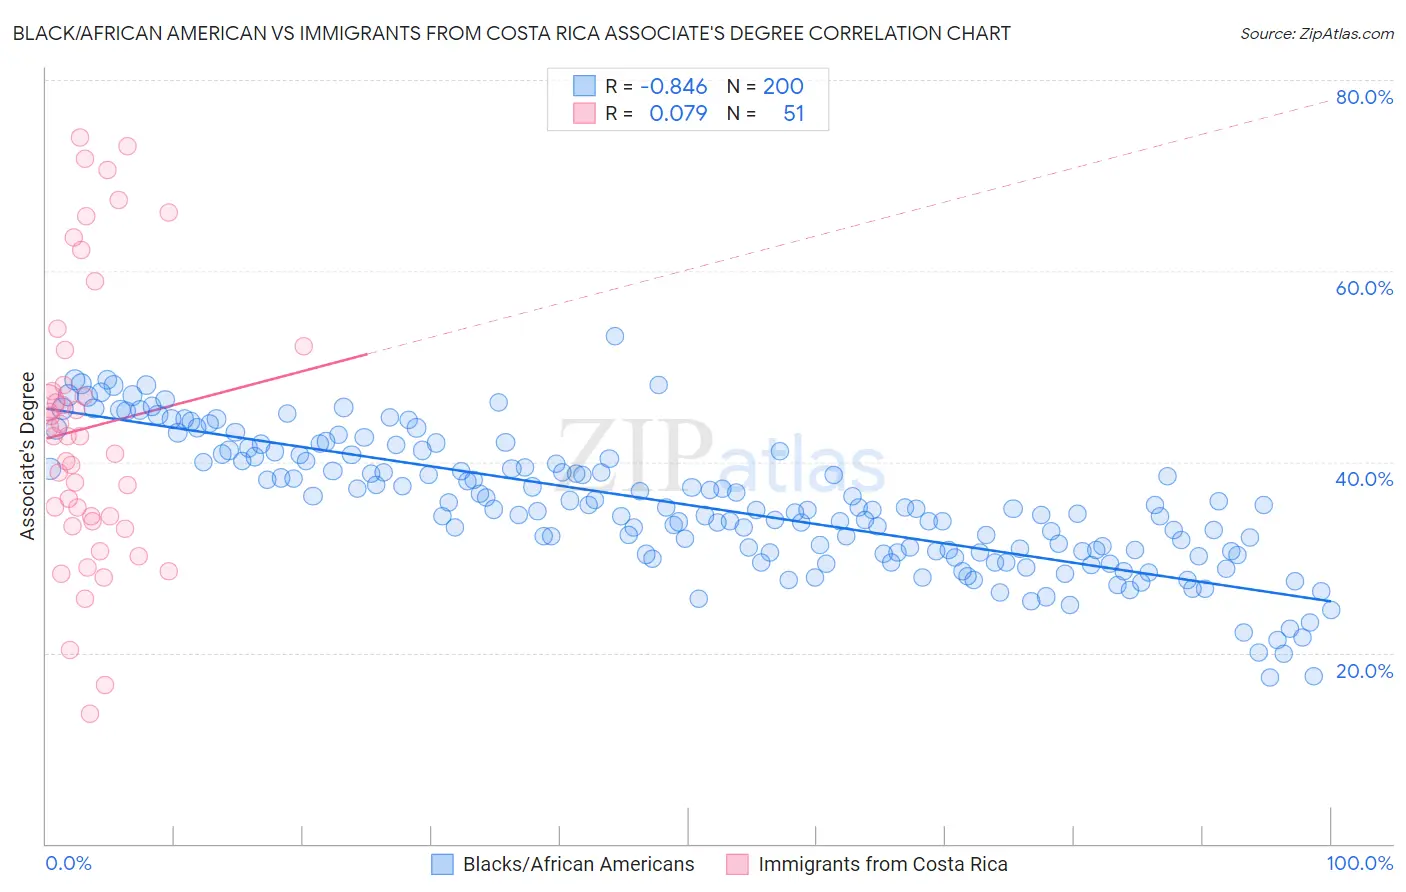
Black/African American vs Immigrants from Costa Rica Associate's Degree Correlation Chart
The statistical analysis conducted on geographies consisting of 565,941,999 people shows a very strong negative correlation between the proportion of Blacks/African Americans and percentage of population with at least associate's degree education in the United States with a correlation coefficient (R) of -0.846 and weighted average of 39.1%. Similarly, the statistical analysis conducted on geographies consisting of 204,274,637 people shows a slight positive correlation between the proportion of Immigrants from Costa Rica and percentage of population with at least associate's degree education in the United States with a correlation coefficient (R) of 0.079 and weighted average of 45.0%, a difference of 14.9%.
Associate's Degree Correlation Summary
| Measurement | Black/African American | Immigrants from Costa Rica |
| Minimum | 17.4% | 13.6% |
| Maximum | 53.2% | 74.0% |
| Range | 35.8% | 60.4% |
| Mean | 35.5% | 43.6% |
| Median | 35.1% | 42.6% |
| Interquartile 25% (IQ1) | 30.6% | 33.8% |
| Interquartile 75% (IQ3) | 40.7% | 51.7% |
| Interquartile Range (IQR) | 10.1% | 17.9% |
| Standard Deviation (Sample) | 6.9% | 14.7% |
| Standard Deviation (Population) | 6.9% | 14.5% |
Similar Demographics by Associate's Degree
Demographics Similar to Blacks/African Americans by Associate's Degree
In terms of associate's degree, the demographic groups most similar to Blacks/African Americans are Nepalese (39.0%, a difference of 0.25%), Salvadoran (39.0%, a difference of 0.25%), Dominican (39.3%, a difference of 0.29%), Immigrants from Haiti (39.3%, a difference of 0.30%), and Honduran (38.9%, a difference of 0.54%).
| Demographics | Rating | Rank | Associate's Degree |
| Immigrants | Belize | 0.1 /100 | #285 | Tragic 39.9% |
| Immigrants | Caribbean | 0.0 /100 | #286 | Tragic 39.7% |
| Aleuts | 0.0 /100 | #287 | Tragic 39.6% |
| Immigrants | Cuba | 0.0 /100 | #288 | Tragic 39.5% |
| Central Americans | 0.0 /100 | #289 | Tragic 39.4% |
| Immigrants | Haiti | 0.0 /100 | #290 | Tragic 39.3% |
| Dominicans | 0.0 /100 | #291 | Tragic 39.3% |
| Blacks/African Americans | 0.0 /100 | #292 | Tragic 39.1% |
| Nepalese | 0.0 /100 | #293 | Tragic 39.0% |
| Salvadorans | 0.0 /100 | #294 | Tragic 39.0% |
| Hondurans | 0.0 /100 | #295 | Tragic 38.9% |
| Cherokee | 0.0 /100 | #296 | Tragic 38.9% |
| Cape Verdeans | 0.0 /100 | #297 | Tragic 38.8% |
| Cheyenne | 0.0 /100 | #298 | Tragic 38.7% |
| Ute | 0.0 /100 | #299 | Tragic 38.6% |
Demographics Similar to Immigrants from Costa Rica by Associate's Degree
In terms of associate's degree, the demographic groups most similar to Immigrants from Costa Rica are Immigrants from Philippines (45.0%, a difference of 0.010%), Immigrants from Zaire (45.0%, a difference of 0.010%), Dutch (45.0%, a difference of 0.11%), Panamanian (45.1%, a difference of 0.22%), and French Canadian (44.9%, a difference of 0.25%).
| Demographics | Rating | Rank | Associate's Degree |
| Spaniards | 20.4 /100 | #202 | Fair 45.2% |
| Immigrants | South Eastern Asia | 20.2 /100 | #203 | Fair 45.2% |
| Nigerians | 19.1 /100 | #204 | Poor 45.1% |
| Immigrants | Thailand | 18.9 /100 | #205 | Poor 45.1% |
| German Russians | 18.9 /100 | #206 | Poor 45.1% |
| Panamanians | 18.4 /100 | #207 | Poor 45.1% |
| Dutch | 17.6 /100 | #208 | Poor 45.0% |
| Immigrants | Costa Rica | 16.7 /100 | #209 | Poor 45.0% |
| Immigrants | Philippines | 16.7 /100 | #210 | Poor 45.0% |
| Immigrants | Zaire | 16.6 /100 | #211 | Poor 45.0% |
| French Canadians | 15.0 /100 | #212 | Poor 44.9% |
| Immigrants | Ghana | 14.2 /100 | #213 | Poor 44.8% |
| Immigrants | Middle Africa | 12.7 /100 | #214 | Poor 44.7% |
| Immigrants | Panama | 12.4 /100 | #215 | Poor 44.7% |
| Immigrants | Nigeria | 11.4 /100 | #216 | Poor 44.6% |