Bhutanese vs Immigrants from Yemen 2nd Grade
COMPARE
Bhutanese
Immigrants from Yemen
2nd Grade
2nd Grade Comparison
Bhutanese
Immigrants from Yemen
98.1%
2ND GRADE
97.5/ 100
METRIC RATING
106th/ 347
METRIC RANK
95.7%
2ND GRADE
0.0/ 100
METRIC RATING
346th/ 347
METRIC RANK
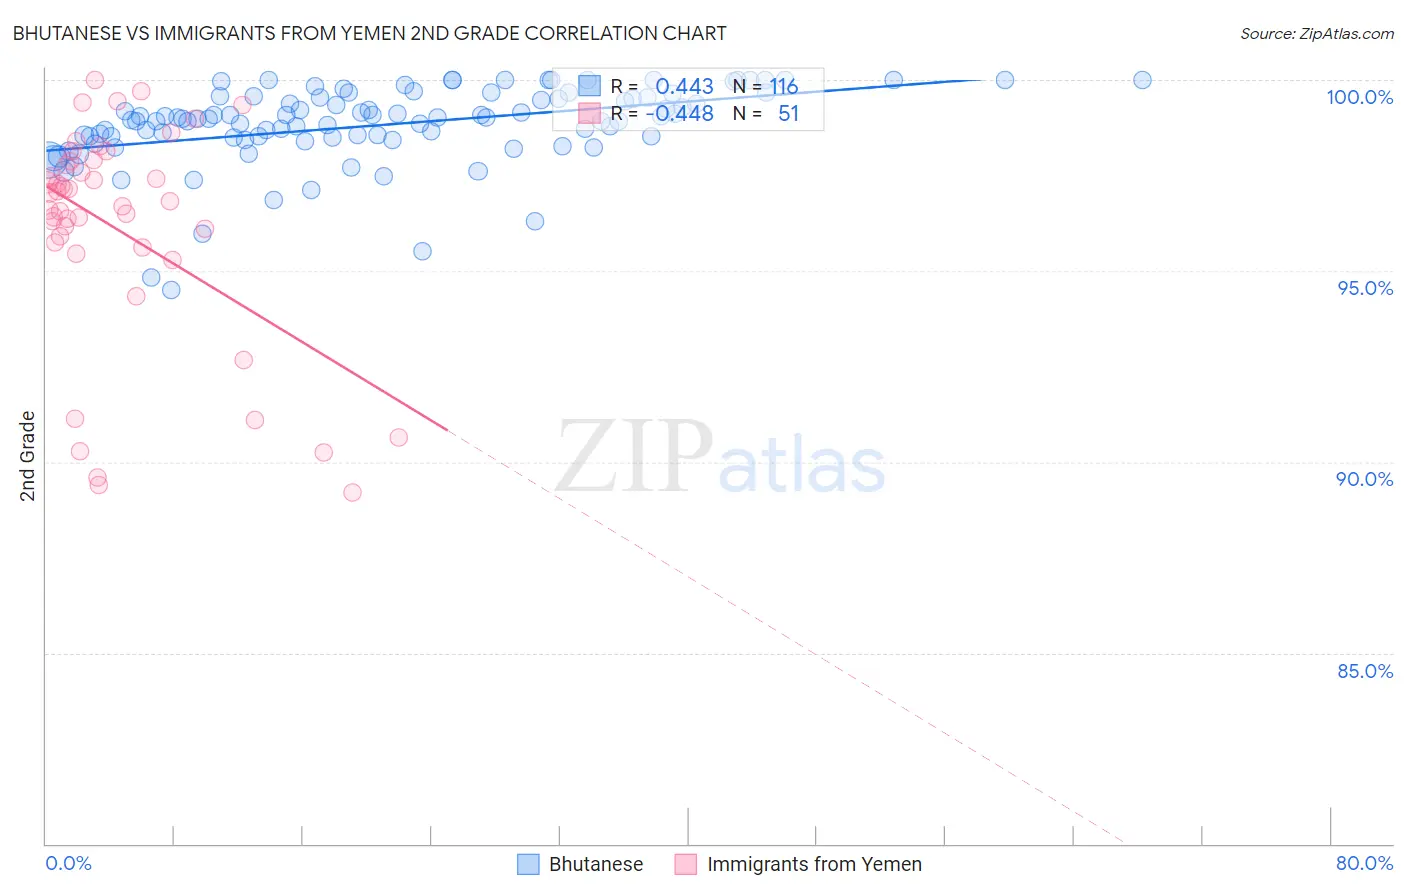
Bhutanese vs Immigrants from Yemen 2nd Grade Correlation Chart
The statistical analysis conducted on geographies consisting of 455,591,119 people shows a moderate positive correlation between the proportion of Bhutanese and percentage of population with at least 2nd grade education in the United States with a correlation coefficient (R) of 0.443 and weighted average of 98.1%. Similarly, the statistical analysis conducted on geographies consisting of 82,433,611 people shows a moderate negative correlation between the proportion of Immigrants from Yemen and percentage of population with at least 2nd grade education in the United States with a correlation coefficient (R) of -0.448 and weighted average of 95.7%, a difference of 2.5%.
2nd Grade Correlation Summary
| Measurement | Bhutanese | Immigrants from Yemen |
| Minimum | 94.5% | 89.2% |
| Maximum | 100.0% | 100.0% |
| Range | 5.5% | 10.8% |
| Mean | 98.8% | 96.1% |
| Median | 99.0% | 96.8% |
| Interquartile 25% (IQ1) | 98.5% | 95.6% |
| Interquartile 75% (IQ3) | 99.5% | 97.9% |
| Interquartile Range (IQR) | 1.0% | 2.3% |
| Standard Deviation (Sample) | 1.0% | 2.9% |
| Standard Deviation (Population) | 1.0% | 2.9% |
Similar Demographics by 2nd Grade
Demographics Similar to Bhutanese by 2nd Grade
In terms of 2nd grade, the demographic groups most similar to Bhutanese are Pima (98.2%, a difference of 0.0%), Turkish (98.2%, a difference of 0.0%), Yugoslavian (98.2%, a difference of 0.0%), German Russian (98.1%, a difference of 0.0%), and Immigrants from Switzerland (98.1%, a difference of 0.0%).
| Demographics | Rating | Rank | 2nd Grade |
| Immigrants | Ireland | 98.0 /100 | #99 | Exceptional 98.2% |
| Romanians | 98.0 /100 | #100 | Exceptional 98.2% |
| Puget Sound Salish | 98.0 /100 | #101 | Exceptional 98.2% |
| Cree | 98.0 /100 | #102 | Exceptional 98.2% |
| Pima | 97.6 /100 | #103 | Exceptional 98.2% |
| Turks | 97.6 /100 | #104 | Exceptional 98.2% |
| Yugoslavians | 97.5 /100 | #105 | Exceptional 98.2% |
| Bhutanese | 97.5 /100 | #106 | Exceptional 98.1% |
| German Russians | 97.4 /100 | #107 | Exceptional 98.1% |
| Immigrants | Switzerland | 97.3 /100 | #108 | Exceptional 98.1% |
| Basques | 97.2 /100 | #109 | Exceptional 98.1% |
| Immigrants | Singapore | 97.0 /100 | #110 | Exceptional 98.1% |
| Immigrants | Czechoslovakia | 96.9 /100 | #111 | Exceptional 98.1% |
| Colville | 96.6 /100 | #112 | Exceptional 98.1% |
| Immigrants | Norway | 96.5 /100 | #113 | Exceptional 98.1% |
Demographics Similar to Immigrants from Yemen by 2nd Grade
In terms of 2nd grade, the demographic groups most similar to Immigrants from Yemen are Immigrants from El Salvador (95.9%, a difference of 0.14%), Spanish American Indian (95.6%, a difference of 0.18%), Salvadoran (96.0%, a difference of 0.31%), Nepalese (96.1%, a difference of 0.34%), and Immigrants from Mexico (96.1%, a difference of 0.43%).
| Demographics | Rating | Rank | 2nd Grade |
| Immigrants | Dominican Republic | 0.0 /100 | #333 | Tragic 96.4% |
| Central Americans | 0.0 /100 | #334 | Tragic 96.4% |
| Yakama | 0.0 /100 | #335 | Tragic 96.4% |
| Immigrants | Fiji | 0.0 /100 | #336 | Tragic 96.4% |
| Immigrants | Cambodia | 0.0 /100 | #337 | Tragic 96.4% |
| Immigrants | Cabo Verde | 0.0 /100 | #338 | Tragic 96.3% |
| Guatemalans | 0.0 /100 | #339 | Tragic 96.3% |
| Immigrants | Guatemala | 0.0 /100 | #340 | Tragic 96.2% |
| Immigrants | Central America | 0.0 /100 | #341 | Tragic 96.2% |
| Immigrants | Mexico | 0.0 /100 | #342 | Tragic 96.1% |
| Nepalese | 0.0 /100 | #343 | Tragic 96.1% |
| Salvadorans | 0.0 /100 | #344 | Tragic 96.0% |
| Immigrants | El Salvador | 0.0 /100 | #345 | Tragic 95.9% |
| Immigrants | Yemen | 0.0 /100 | #346 | Tragic 95.7% |
| Spanish American Indians | 0.0 /100 | #347 | Tragic 95.6% |