Bermudan vs Polish 11th Grade
COMPARE
Bermudan
Polish
11th Grade
11th Grade Comparison
Bermudans
Poles
92.6%
11TH GRADE
62.3/ 100
METRIC RATING
166th/ 347
METRIC RANK
94.8%
11TH GRADE
100.0/ 100
METRIC RATING
7th/ 347
METRIC RANK
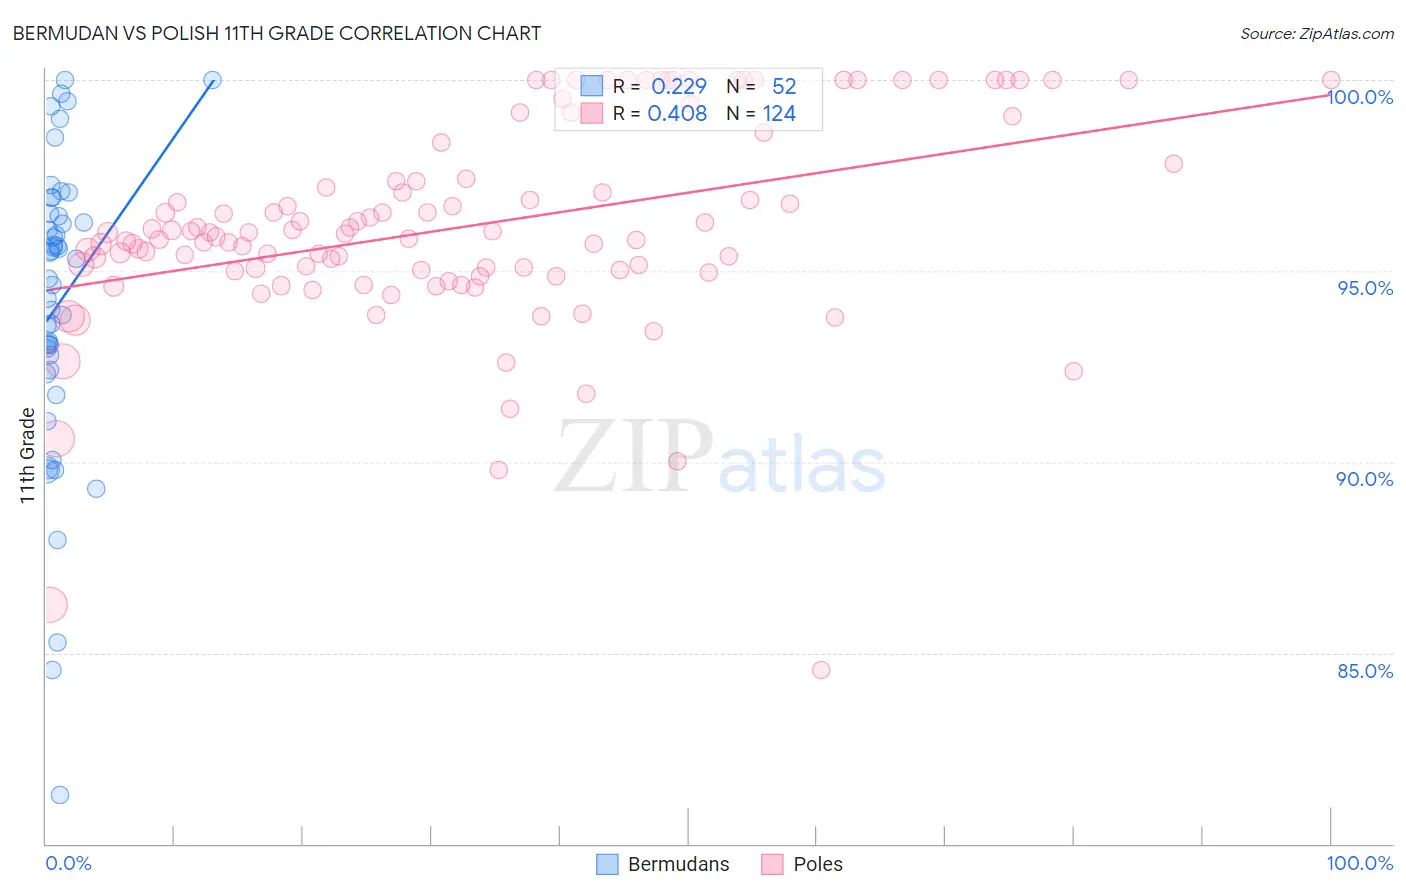
Bermudan vs Polish 11th Grade Correlation Chart
The statistical analysis conducted on geographies consisting of 55,730,379 people shows a weak positive correlation between the proportion of Bermudans and percentage of population with at least 11th grade education in the United States with a correlation coefficient (R) of 0.229 and weighted average of 92.6%. Similarly, the statistical analysis conducted on geographies consisting of 560,594,575 people shows a moderate positive correlation between the proportion of Poles and percentage of population with at least 11th grade education in the United States with a correlation coefficient (R) of 0.408 and weighted average of 94.8%, a difference of 2.3%.
11th Grade Correlation Summary
| Measurement | Bermudan | Polish |
| Minimum | 81.3% | 84.5% |
| Maximum | 100.0% | 100.0% |
| Range | 18.7% | 15.5% |
| Mean | 94.1% | 96.2% |
| Median | 95.1% | 96.0% |
| Interquartile 25% (IQ1) | 92.6% | 95.0% |
| Interquartile 75% (IQ3) | 96.5% | 97.6% |
| Interquartile Range (IQR) | 3.9% | 2.6% |
| Standard Deviation (Sample) | 3.9% | 2.7% |
| Standard Deviation (Population) | 3.9% | 2.7% |
Similar Demographics by 11th Grade
Demographics Similar to Bermudans by 11th Grade
In terms of 11th grade, the demographic groups most similar to Bermudans are Immigrants from Iraq (92.6%, a difference of 0.010%), Alsatian (92.6%, a difference of 0.020%), Spanish (92.7%, a difference of 0.040%), Sierra Leonean (92.6%, a difference of 0.040%), and Nonimmigrants (92.7%, a difference of 0.050%).
| Demographics | Rating | Rank | 11th Grade |
| Americans | 71.7 /100 | #159 | Good 92.7% |
| Immigrants | Lebanon | 70.7 /100 | #160 | Good 92.7% |
| Immigrants | Argentina | 69.8 /100 | #161 | Good 92.7% |
| Paraguayans | 68.7 /100 | #162 | Good 92.7% |
| Immigrants | Nonimmigrants | 66.6 /100 | #163 | Good 92.7% |
| Spanish | 66.2 /100 | #164 | Good 92.7% |
| Immigrants | Iraq | 63.7 /100 | #165 | Good 92.6% |
| Bermudans | 62.3 /100 | #166 | Good 92.6% |
| Alsatians | 60.2 /100 | #167 | Good 92.6% |
| Sierra Leoneans | 58.7 /100 | #168 | Average 92.6% |
| Immigrants | Albania | 57.8 /100 | #169 | Average 92.6% |
| Immigrants | Northern Africa | 57.3 /100 | #170 | Average 92.6% |
| Laotians | 54.4 /100 | #171 | Average 92.6% |
| Immigrants | Pakistan | 52.3 /100 | #172 | Average 92.5% |
| Indians (Asian) | 51.5 /100 | #173 | Average 92.5% |
Demographics Similar to Poles by 11th Grade
In terms of 11th grade, the demographic groups most similar to Poles are Croatian (94.7%, a difference of 0.010%), Lithuanian (94.8%, a difference of 0.050%), Danish (94.7%, a difference of 0.050%), Finnish (94.7%, a difference of 0.090%), and Carpatho Rusyn (94.8%, a difference of 0.10%).
| Demographics | Rating | Rank | 11th Grade |
| Norwegians | 100.0 /100 | #1 | Exceptional 95.2% |
| Swedes | 100.0 /100 | #2 | Exceptional 94.9% |
| Slovenes | 100.0 /100 | #3 | Exceptional 94.9% |
| Slovaks | 100.0 /100 | #4 | Exceptional 94.9% |
| Carpatho Rusyns | 100.0 /100 | #5 | Exceptional 94.8% |
| Lithuanians | 100.0 /100 | #6 | Exceptional 94.8% |
| Poles | 100.0 /100 | #7 | Exceptional 94.8% |
| Croatians | 100.0 /100 | #8 | Exceptional 94.7% |
| Danes | 100.0 /100 | #9 | Exceptional 94.7% |
| Finns | 100.0 /100 | #10 | Exceptional 94.7% |
| Germans | 100.0 /100 | #11 | Exceptional 94.7% |
| Latvians | 100.0 /100 | #12 | Exceptional 94.7% |
| Chinese | 100.0 /100 | #13 | Exceptional 94.6% |
| Eastern Europeans | 100.0 /100 | #14 | Exceptional 94.6% |
| Bulgarians | 100.0 /100 | #15 | Exceptional 94.5% |