Belizean vs Yaqui Doctorate Degree
COMPARE
Belizean
Yaqui
Doctorate Degree
Doctorate Degree Comparison
Belizeans
Yaqui
1.4%
DOCTORATE DEGREE
0.1/ 100
METRIC RATING
299th/ 347
METRIC RANK
1.5%
DOCTORATE DEGREE
0.4/ 100
METRIC RATING
274th/ 347
METRIC RANK
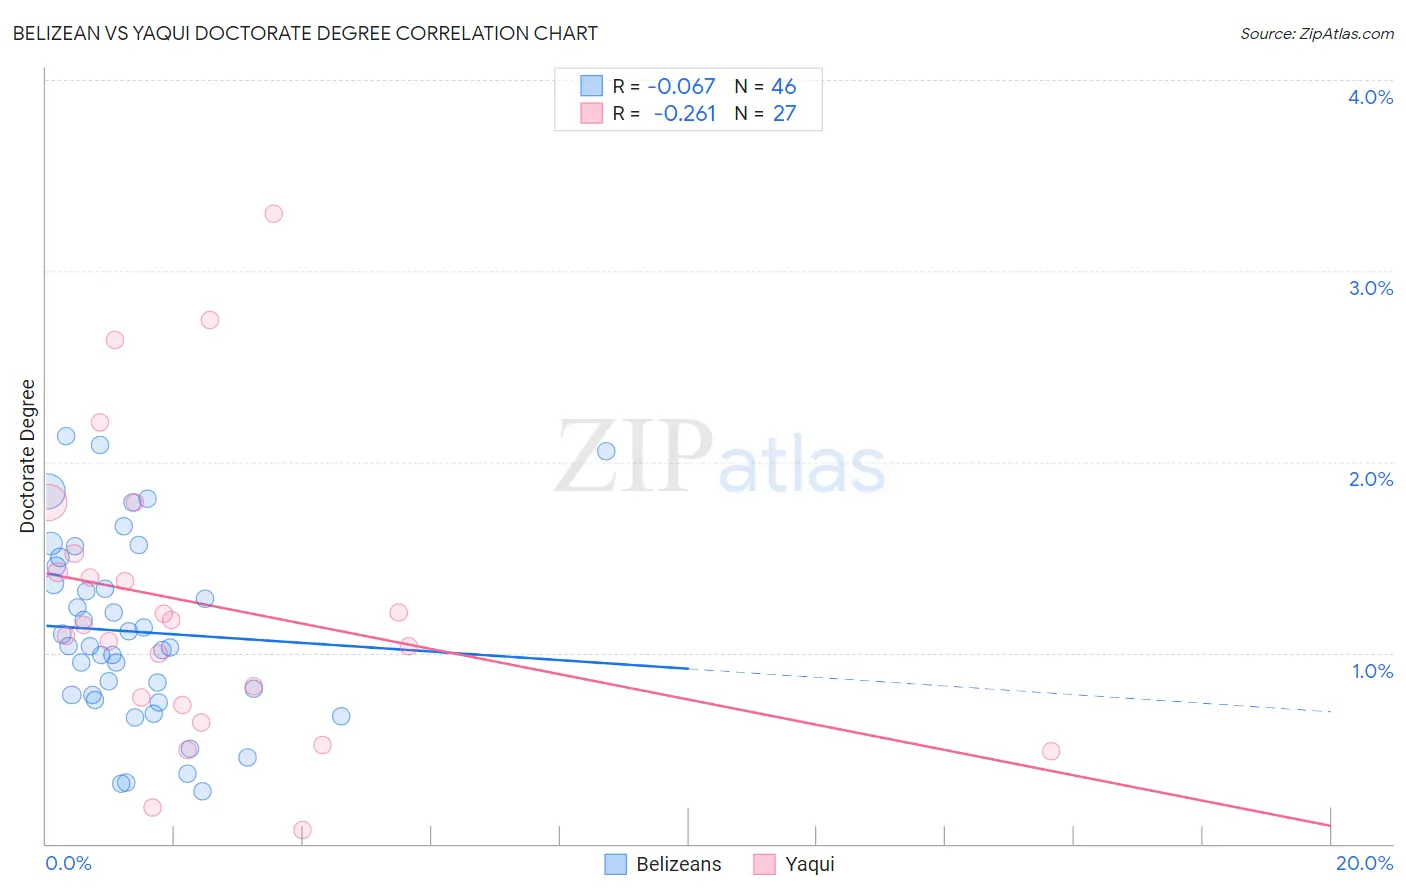
Belizean vs Yaqui Doctorate Degree Correlation Chart
The statistical analysis conducted on geographies consisting of 143,625,069 people shows a slight negative correlation between the proportion of Belizeans and percentage of population with at least doctorate degree education in the United States with a correlation coefficient (R) of -0.067 and weighted average of 1.4%. Similarly, the statistical analysis conducted on geographies consisting of 107,124,723 people shows a weak negative correlation between the proportion of Yaqui and percentage of population with at least doctorate degree education in the United States with a correlation coefficient (R) of -0.261 and weighted average of 1.5%, a difference of 5.7%.
Doctorate Degree Correlation Summary
| Measurement | Belizean | Yaqui |
| Minimum | 0.28% | 0.075% |
| Maximum | 2.1% | 3.3% |
| Range | 1.9% | 3.2% |
| Mean | 1.1% | 1.3% |
| Median | 1.0% | 1.1% |
| Interquartile 25% (IQ1) | 0.78% | 0.73% |
| Interquartile 75% (IQ3) | 1.5% | 1.5% |
| Interquartile Range (IQR) | 0.68% | 0.79% |
| Standard Deviation (Sample) | 0.48% | 0.77% |
| Standard Deviation (Population) | 0.48% | 0.76% |
Similar Demographics by Doctorate Degree
Demographics Similar to Belizeans by Doctorate Degree
In terms of doctorate degree, the demographic groups most similar to Belizeans are Immigrants from Guatemala (1.4%, a difference of 0.33%), Honduran (1.4%, a difference of 0.40%), Puerto Rican (1.4%, a difference of 0.43%), Shoshone (1.4%, a difference of 0.73%), and Immigrants from Dominica (1.4%, a difference of 0.76%).
| Demographics | Rating | Rank | Doctorate Degree |
| Alaska Natives | 0.3 /100 | #292 | Tragic 1.4% |
| Immigrants | Yemen | 0.2 /100 | #293 | Tragic 1.4% |
| Samoans | 0.2 /100 | #294 | Tragic 1.4% |
| Guatemalans | 0.2 /100 | #295 | Tragic 1.4% |
| Immigrants | Ecuador | 0.2 /100 | #296 | Tragic 1.4% |
| Tsimshian | 0.2 /100 | #297 | Tragic 1.4% |
| Puerto Ricans | 0.1 /100 | #298 | Tragic 1.4% |
| Belizeans | 0.1 /100 | #299 | Tragic 1.4% |
| Immigrants | Guatemala | 0.1 /100 | #300 | Tragic 1.4% |
| Hondurans | 0.1 /100 | #301 | Tragic 1.4% |
| Shoshone | 0.1 /100 | #302 | Tragic 1.4% |
| Immigrants | Dominica | 0.1 /100 | #303 | Tragic 1.4% |
| Mexican American Indians | 0.1 /100 | #304 | Tragic 1.4% |
| Pennsylvania Germans | 0.1 /100 | #305 | Tragic 1.4% |
| Guyanese | 0.1 /100 | #306 | Tragic 1.4% |
Demographics Similar to Yaqui by Doctorate Degree
In terms of doctorate degree, the demographic groups most similar to Yaqui are Sioux (1.5%, a difference of 0.020%), Aleut (1.5%, a difference of 0.12%), Immigrants from Barbados (1.5%, a difference of 0.13%), Paiute (1.5%, a difference of 0.17%), and Immigrants from Trinidad and Tobago (1.5%, a difference of 0.22%).
| Demographics | Rating | Rank | Doctorate Degree |
| Kiowa | 0.5 /100 | #267 | Tragic 1.5% |
| U.S. Virgin Islanders | 0.5 /100 | #268 | Tragic 1.5% |
| Crow | 0.5 /100 | #269 | Tragic 1.5% |
| Salvadorans | 0.5 /100 | #270 | Tragic 1.5% |
| Immigrants | Trinidad and Tobago | 0.5 /100 | #271 | Tragic 1.5% |
| Immigrants | Barbados | 0.4 /100 | #272 | Tragic 1.5% |
| Sioux | 0.4 /100 | #273 | Tragic 1.5% |
| Yaqui | 0.4 /100 | #274 | Tragic 1.5% |
| Aleuts | 0.4 /100 | #275 | Tragic 1.5% |
| Paiute | 0.4 /100 | #276 | Tragic 1.5% |
| Bahamians | 0.4 /100 | #277 | Tragic 1.5% |
| Hawaiians | 0.4 /100 | #278 | Tragic 1.5% |
| Marshallese | 0.4 /100 | #279 | Tragic 1.5% |
| Ecuadorians | 0.4 /100 | #280 | Tragic 1.5% |
| Tohono O'odham | 0.4 /100 | #281 | Tragic 1.5% |